•Digital revenue up 13%, and 16% on a constant-currency basis
•Cash balance of $219 million following $114 million semi-annual cash interest payment
•Cash balance of $219 million following $114 million semi-annual cash interest payment
Warner Music Group Corp. today announced its fiscal third quarter financial results for the period ended June 30, 2012.
“There were several bright spots in our results for the quarter,” said Stephen Cooper, Warner Music Group’s CEO. “In our Music Publishing business, we grew OIBDA, OIBDA margin and constant-currency revenue. In our Recorded Music business, strong growth in digital revenue more than offset the decline in physical revenue on a constant-currency basis, showing the promise of the industry’s transformation. We look forward to the fourth quarter and the next fiscal year, as we work to accelerate our progress.”
“Our Unlevered After-Tax Cash Flow was strong,” said Warner Music Group Executive Vice President and CFO Brian Roberts, adding, “The decline in total cash balance was expected, due to our semi-annual cash interest payment this quarter.”
Total WMG
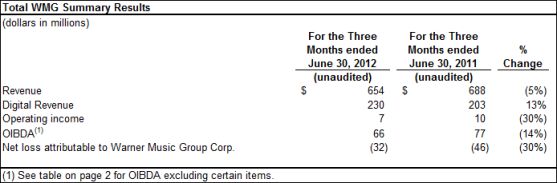
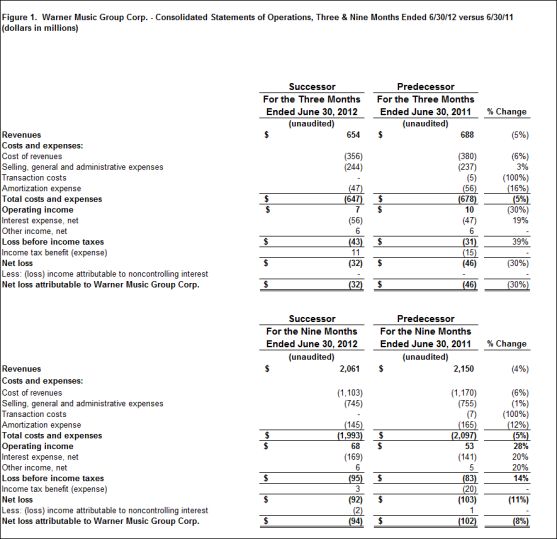
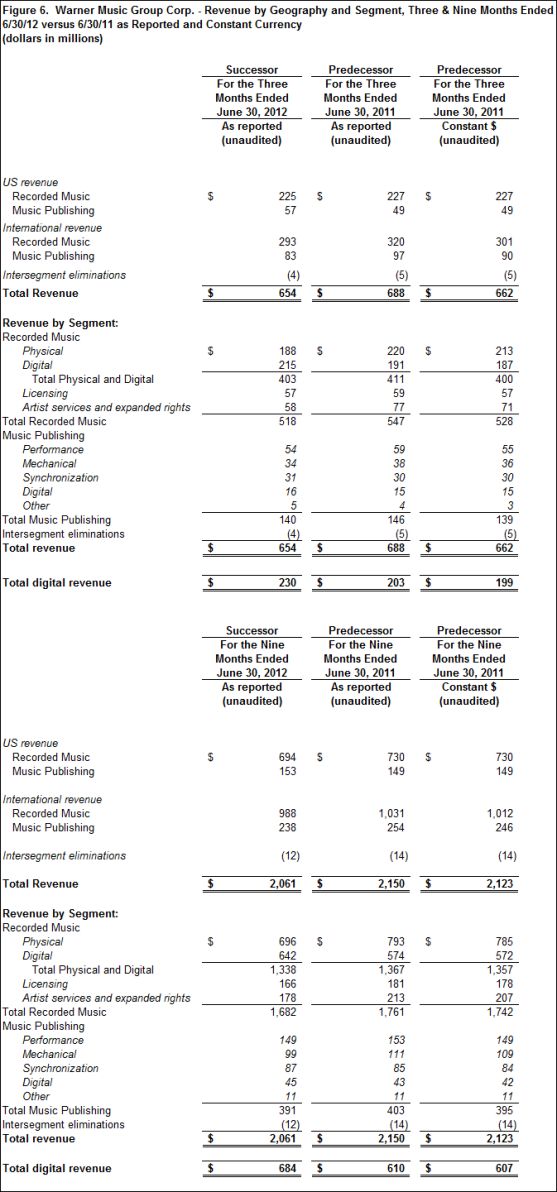
Revenue declined 4.9%, largely related to the unfavorable impact of foreign currency exchange rates. On a constant-currency basis, revenue declined 1.2% as strong growth in digital revenue and growth in total Music Publishing revenue was more than offset by continued physical revenue declines in the recorded music industry and declines in concert promotion revenue as compared to the results from the prior-year quarter’s strong touring schedule in France. Revenue growth in the U.S., Germany, Italy, Canada, Latin America and parts of Asia was more than offset by weakness in France and Japan. Digital revenue represented 35.2% of total revenue for the quarter, compared to 29.5% in the prior-year quarter. Increased digital revenue reflects global growth in downloads and subscription/streaming services, partially offset by continued declines in the ringtone business. (See Figure 6 below for a definition, calculation and reconciliation of Constant Currency.)
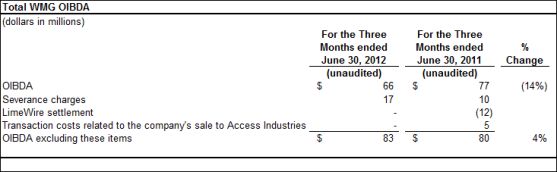
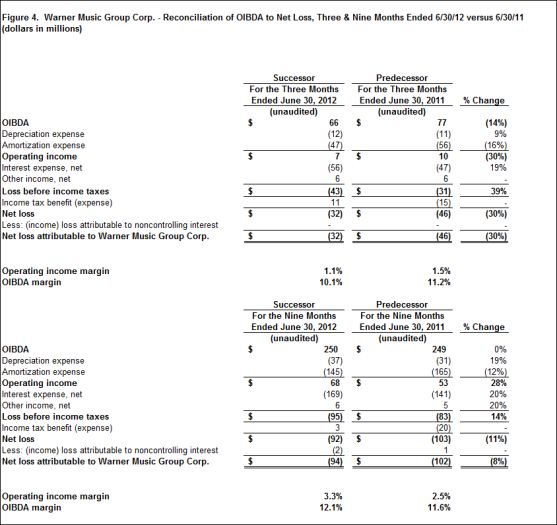
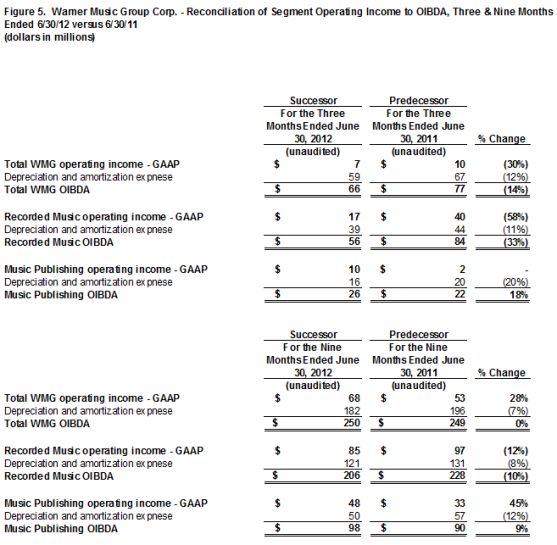
Operating margin contracted 0.4 percentage points to 1.1% from 1.5%. OIBDA margin contracted 1.1 percentage points to 10.1% from 11.2%. Operating income and OIBDA included $17 million of severance charges ($16 million in Recorded Music and $1 million in Music Publishing), compared to $10 million of severance charges in the prior-year quarter ($3 million in Recorded Music, $2 million in Music Publishing and $5 million in Corporate) (the “Quarterly Severance Charges”). Additionally, operating income and OIBDA in the prior-year quarter included a $12 million benefit from a recorded music legal settlement with LimeWire (the “LimeWire Settlement”) as well as $5 million in transaction costs related to the company’s sale to Access Industries. Excluding these items, operating income grew 84.6% to $24 million from $13 million, OIBDA grew 3.8% to $83 million from $80 million and OIBDA margin expanded 1.1 percentage points to 12.7%. (See Figures 4 and 5 below for definitions, calculations and reconciliations of OIBDA and OIBDA margin.)
Net loss included a change in the tax provision to a benefit of $11 million from an expense of $15 million in the prior-year quarter, largely related to an increase in losses due to severance in foreign jurisdictions. This impact was partially offset by an increase in interest expense, to $56 million from $47 million, related to the July 2011 refinancing of certain existing indebtedness related to the company’s sale to Access Industries.
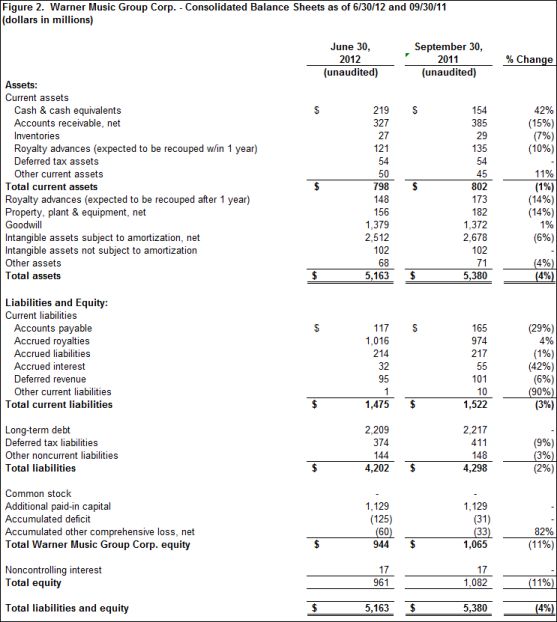
As of June 30, 2012, the company reported a cash balance of $219 million, total long-term debt of $2.209 billion and net debt (total long-term debt minus cash) of $1.990 billion.
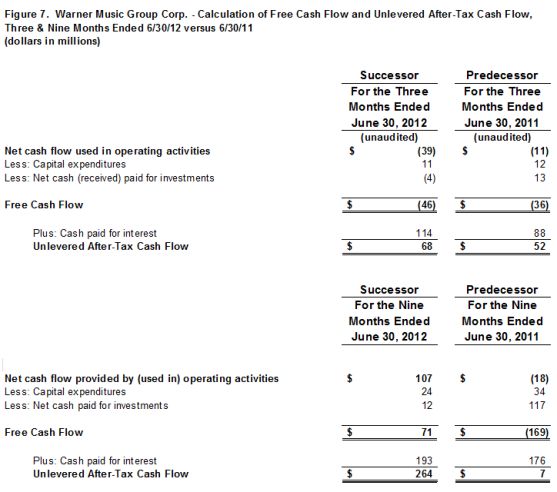
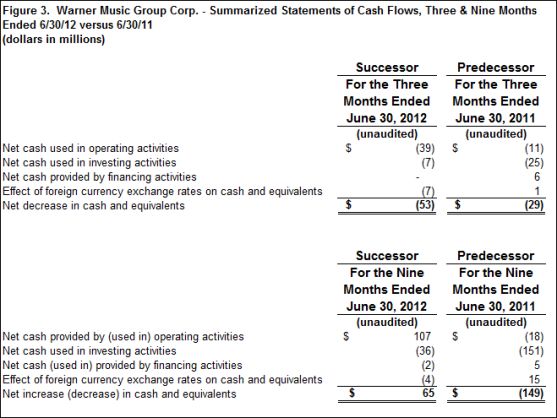
Cash used in operating activities was $39 million compared to $11 million in the prior-year quarter. Free Cash Flow was negative $46 million compared to negative $36 million in the prior-year quarter. The decline in Free Cash Flow reflects the increase in cash interest to $114 million from $88 million in the prior-year quarter. Unlevered After-Tax Cash Flow increased to $68 million from $52 million in the prior-year quarter. (See Figure 7 below for a definition, calculation and reconciliation of Free Cash Flow and Unlevered After-Tax Cash Flow.)
Recorded Music
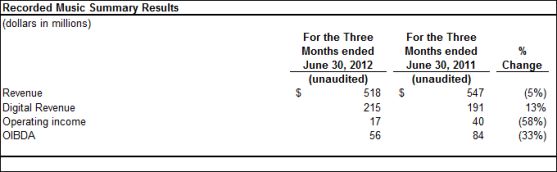
Recorded Music revenue declined 5.3%, largely related to the unfavorable impact of foreign currency exchange rates. On a constant-currency basis, Recorded Music revenue declined 1.9%. The increase in Recorded Music digital revenue more than offset the decline in physical revenue on a constant-currency basis. However, artist services and expanded rights revenue was lower due to concert promotion revenue declines as compared to the results from the prior-year quarter’s strong touring schedule in France. Recorded Music digital revenue grew, up 12.6%, or 15.0% on a constant-currency basis, as global download and subscription/streaming revenue were both strong. Recorded Music digital revenue represented 41.5% of total Recorded Music revenue, compared to 34.9% in the prior-year quarter. Domestic Recorded Music digital revenue was $121 million, or 53.8% of total domestic Recorded Music revenue, compared to 47.6% in the prior-year quarter. Major sellers included Linkin Park, Jason Mraz, Germany’s Die Toten Hosen, FUN and B.O.B. Linkin Park’s new album “Living Things” debuted at No. 1 on the Billboard 200 in June. “Living Things” became Linkin Park’s fifth No. 1 album since 2000, the most No. 1 albums for any group since 2000 according to Billboard.
Recorded Music operating margin contracted 4.0 percentage points to 3.3% from 7.3% in the prior-year quarter. Recorded Music OIBDA margin contracted 4.6 percentage points to 10.8% from 15.4% in the prior-year quarter. Operating income and OIBDA reflect the impact of the Quarterly Severance Charges and the LimeWire Settlement. Excluding these items, operating income grew 6.5% to $33 million from $31 million, OIBDA declined 4.0% to $72 million from $75 million and OIBDA margin expanded 0.2 percentage points to 13.9%. The decline in OIBDA was primarily due to the decline in revenue.
Music Publishing
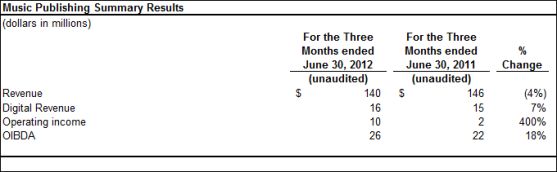
Music Publishing revenue declined 4.1%, but grew 0.7% on a constant-currency basis. The company’s Music Publishing business experienced 6.7% growth in digital revenue, on both a reported and constant-currency basis, as download and subscription/streaming revenue were strong. Synchronization revenue grew 3.3%, on both a reported and constant-currency basis, due to the timing of collections. Performance revenue declined 8.5%, or 1.8% on a constant-currency basis, partially due to an industry-wide reduction in U.S. radio license fees as mentioned last quarter. Mechanical revenue declined 10.5%, or 5.6% on a constant-currency basis, reflecting the ongoing transition in the recorded music industry. The company recently acquired the masters and publishing rights for all film music owned and controlled by Miramax, boosting the offerings of the company’s Music Publishing synchronization and performance businesses.
The company’s Music Publishing OIBDA and OIBDA margin increased largely as a result of the successful execution of an improved A&R investment and acquisition strategy focused on higher-margin assets. Music Publishing operating margin expanded 5.7 percentage points to 7.1% from 1.4% in the prior-year quarter. Music Publishing OIBDA margin expanded 3.5 percentage points to 18.6% from 15.1%. Operating income and OIBDA reflect the impact of the Quarterly Severance Charges.
Financial details for the quarter can be found in the company’s current Form 10-Q, for the period ended June 30, 2012, filed today with the Securities and Exchange Commission.
This morning, management will be hosting a conference call to discuss the results at 8:30 A.M. EST. The call will be webcast on www.wmg.com.
About Warner Music Group
With its broad roster of new stars and legendary artists, Warner Music Group is home to a collection of the best-known record labels in the music industry including Asylum, Atlantic, East West, Elektra, Nonesuch, Reprise, Rhino, Roadrunner, Rykodisc, Sire, Warner Bros. and Word, as well as Warner/Chappell Music, one of the world’s leading music publishers, with a catalog of more than one million copyrights worldwide.
“Safe Harbor” Statement under Private Securities Litigation Reform Act of 1995
This communication includes forward-looking statements that reflect the current views of Warner Music Group about future events and financial performance. Words such as “estimates,” “expects,” “anticipates,” “projects,” “plans,” “intends,” “believes,” “forecasts” and variations of such words or similar expressions that predict or indicate future events or trends, or that do not relate to historical matters, identify forward-looking statements. All forward-looking statements are made as of today, and we disclaim any duty to update such statements. Our expectations, beliefs and projections are expressed in good faith and we believe there is a reasonable basis for them. However, we cannot assure you that management’s expectations, beliefs and projections will result or be achieved. Investors should not rely on forward-looking statements because they are subject to a variety of risks, uncertainties, and other factors that could cause actual results to differ materially from our expectations. Please refer to our Form 10-K, Form 10-Qs and our other filings with the U.S. Securities and Exchange Commission concerning factors that could cause actual results to differ materially from those described in our forward-looking statements.
This communication includes forward-looking statements that reflect the current views of Warner Music Group about future events and financial performance. Words such as “estimates,” “expects,” “anticipates,” “projects,” “plans,” “intends,” “believes,” “forecasts” and variations of such words or similar expressions that predict or indicate future events or trends, or that do not relate to historical matters, identify forward-looking statements. All forward-looking statements are made as of today, and we disclaim any duty to update such statements. Our expectations, beliefs and projections are expressed in good faith and we believe there is a reasonable basis for them. However, we cannot assure you that management’s expectations, beliefs and projections will result or be achieved. Investors should not rely on forward-looking statements because they are subject to a variety of risks, uncertainties, and other factors that could cause actual results to differ materially from our expectations. Please refer to our Form 10-K, Form 10-Qs and our other filings with the U.S. Securities and Exchange Commission concerning factors that could cause actual results to differ materially from those described in our forward-looking statements.
We maintain an Internet site at www.wmg.com. We use our website as a channel of distribution of material company information. Financial and other material information regarding Warner Music Group is routinely posted on and accessible at https://investors.wmg.com. In addition, you may automatically receive email alerts and other information about Warner Music Group by enrolling your email by visiting the “email alerts” section at https://investors.wmg.com. Our website and the information posted on it or connected to it shall not be deemed to be incorporated by reference into this communication.
Supplemental Disclosures Regarding Non-GAAP Financial Measures
We evaluate our operating performance based on several factors, including the following non-GAAP financial measures:
OIBDA
OIBDA reflects our operating income before non-cash depreciation of tangible assets, non-cash amortization of intangible assets and non-cash impairment charges to reduce the carrying value of goodwill and intangible assets. We consider OIBDA to be an important indicator of the operational strengths and performance of our businesses, and believe the presentation of OIBDA helps improve the ability to understand the company’s operating performance and evaluate our performance in comparison to comparable periods. However, a limitation of the use of OIBDA as a performance measure is that it does not reflect the periodic costs of certain capitalized tangible and intangible assets used in generating revenue in our businesses. Accordingly, OIBDA should be considered in addition to, not as a substitute for, operating income, net income (loss) and other measures of financial performance reported in accordance with accounting principles generally accepted in the U.S (“GAAP”). In addition, OIBDA, as we calculate it, may not be comparable to similarly titled measures employed by other companies.
Constant Currency
Because exchange rates are an important factor in understanding period-to-period comparisons, we believe the presentation of revenue on a constant-currency basis in addition to reported revenue helps improve the ability to understand our operating results and evaluate our performance in comparison to prior periods. Constant-currency information compares results between periods as if exchange rates had remained constant period over period. We use results on a constant-currency basis as one measure to evaluate our performance. We calculate constant-currency results by applying current-year foreign currency exchange rates to prior-year results. However, a limitation of the use of the constant-currency results as a performance measure is that it does not reflect the impact of exchange rates on our revenue, including, for example, the $26 million, $19 million and $7 million unfavorable impact of exchange rates on our Total, Recorded Music and Music Publishing revenue, in the three months ended June 30, 2012 compared to the prior-year quarter. These results should be considered in addition to, not as a substitute for, results reported in accordance with GAAP. Results on a constant-currency basis, as we present them, may not be comparable to similarly titled measures used by other companies and are not a measure of performance presented in accordance with GAAP.
Free Cash Flow
Free Cash Flow reflects our cash flow provided by operating activities less capital expenditures and cash paid or received for investments. We use Free Cash Flow, among other measures, to evaluate our operating performance. Management believes Free Cash Flow provides investors with an important perspective on the cash available to service debt, fund ongoing operations and working capital needs, make strategic acquisitions and investments and pay any dividends or fund any repurchases of our outstanding notes in open market purchases, privately negotiated purchases or otherwise. As a result, Free Cash Flow is a significant measure of our ability to generate long-term value. It is useful for investors to know whether this ability is being enhanced or degraded as a result of our operating performance. We believe the presentation of Free Cash Flow is relevant and useful for investors because it allows investors to view performance in a manner similar to the method used by management. In addition, Free Cash Flow is also a primary measure used externally by our investors and analysts for purposes of valuation and comparing the operating performance of our company to other companies in our industry.
Because Free Cash Flow is not a measure of performance calculated in accordance with GAAP, Free Cash Flow should not be considered in isolation of, or as a substitute for, net income (loss) as an indicator of operating performance or cash flow provided by operating activities as a measure of liquidity. Free Cash Flow, as we calculate it, may not be comparable to similarly titled measures employed by other companies. In addition, Free Cash Flow does not necessarily represent funds available for discretionary use and is not necessarily a measure of our ability to fund our cash needs. Because Free Cash Flow deducts capital expenditures and cash paid or received for investments from “cash flow provided by operating activities” (the most directly comparable GAAP financial measure), users of this information should consider the types of events and transactions that are not reflected. We provide below a reconciliation of Free Cash Flow to the most directly comparable amount reported under GAAP, which is net cash flow (used in) provided by operating activities.”
Unlevered After-Tax Cash Flow
Free Cash Flow includes cash paid for interest. We also review our cash flow adjusted for cash paid for interest, a measure we call Unlevered After-Tax Cash Flow. Management believes this measure provides investors with an additional important perspective on our cash generation ability. We consider Unlevered After-Tax Cash Flow to be an important indicator of the performance of our businesses and believe the presentation is relevant and useful for investors because it allows investors to view performance in a manner similar to the method used by management. A limitation of the use of this measure is that it does not reflect the charges for cash interest and, therefore, does not necessarily represent funds available for discretionary use, and is not necessarily a measure of the company’s ability to fund its cash needs. Accordingly, this measure should be considered in addition to, not as a substitute for, net cash flow provided by operating activities and other measures of liquidity reported in accordance with GAAP.