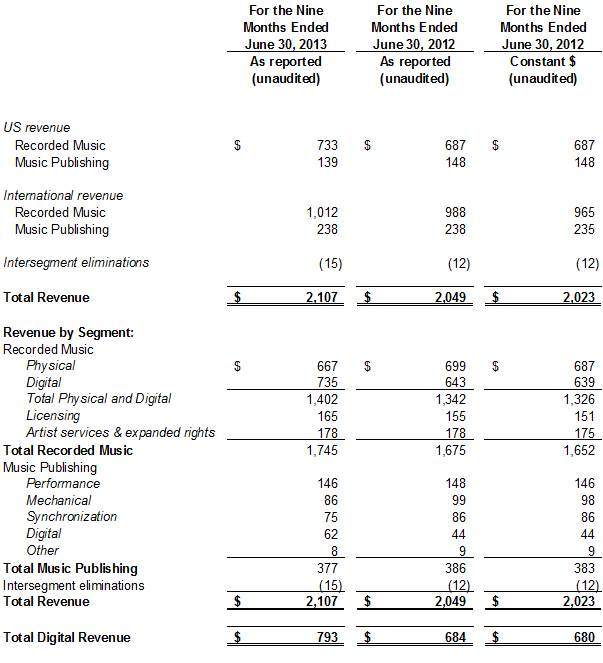
- Total digital revenue grows by 11.7%
- Recorded Music revenue up 3.3%
- OIBDA and OIBDA margin improve
- Parlophone Label Group acquisition closed on July 1st
Warner Music Group Corp. today announced its fiscal third quarter financial results for the period ended June 30, 2013.
“We recorded a solid quarter, having released several successful albums and delivered strong performance from carryover releases, while continuing to exercise financial discipline and to benefit from the outstanding execution of our operators,” said Stephen Cooper, Warner Music Group’s CEO. “We are also very pleased that, on July 1st, we closed the acquisition of Parlophone Label Group and we are now moving forward with our plans for Parlophone’s extraordinary artists, legendary catalog and talented team.”
“Both Recorded Music and Music Publishing contributed to an increase in our total digital revenue, and both segments contributed to our improved OIBDA and OIBDA margin this quarter,” added Brian Roberts, Warner Music Group’s Executive Vice President and CFO. “In addition, we paid down $175 million in debt during the quarter.”
Total WMG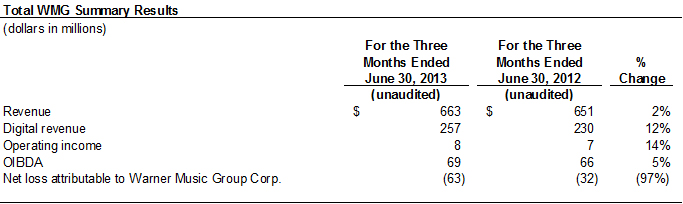
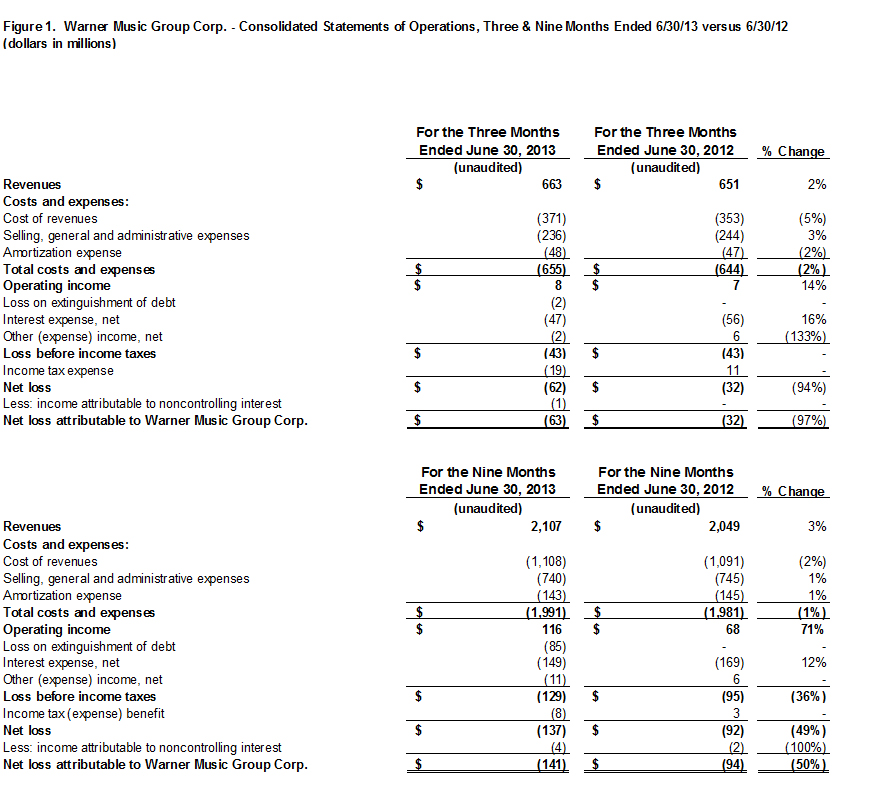
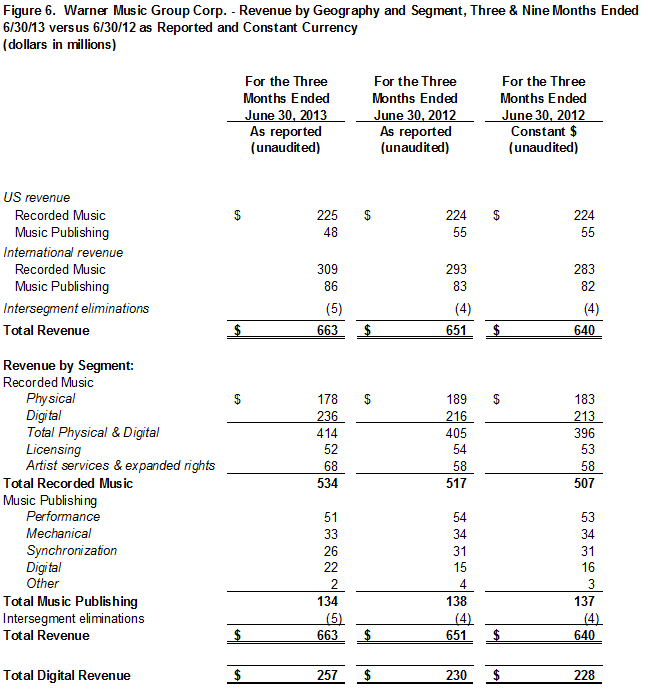
For the quarter, revenue grew 1.8%, or 3.6% in constant currency. Digital revenue in both Recorded Music and Music Publishing was the key driver, offsetting declines in Physical Recorded Music revenue. Digital revenue represented 38.8% of total revenue for the quarter, compared to 35.3% in the prior-year quarter. The growth in digital revenue of 11.7% reflects growth in subscription and streaming revenue as well as download revenue.
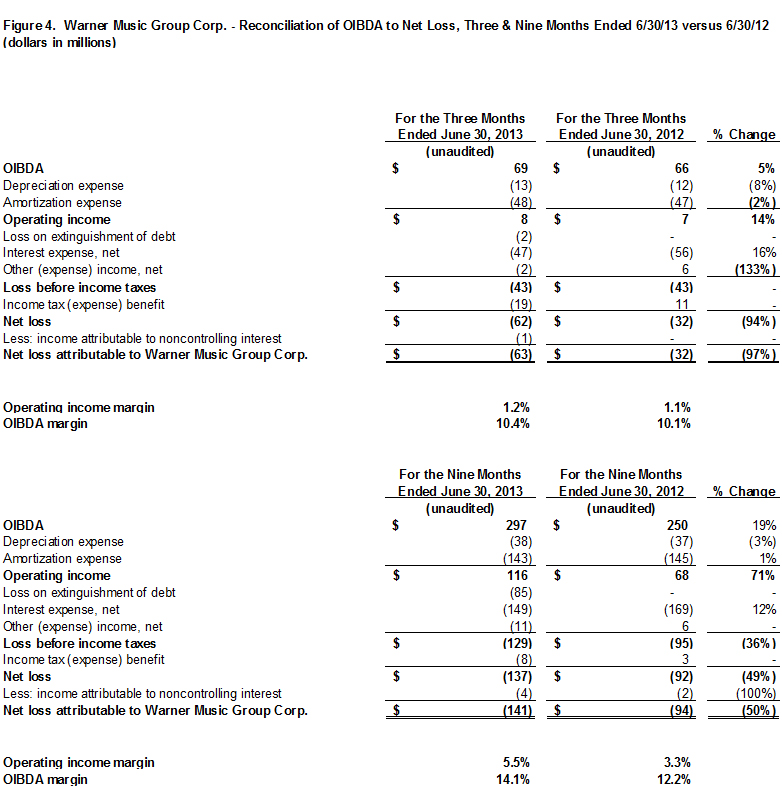
Operating margin was up to 1.2% from 1.1%. OIBDA margin was also up to 10.4% from 10.1%. The improvements in OIBDA and OIBDA margin were due to an increase in revenue and a decrease in selling, general and administrative expenses, partially offset by higher cost of revenue. Operating income and OIBDA included $7 million of integration expenses attributable to the Parlophone acquisition and $5 million of severance charges compared to $17 million of severance charges in the prior-year quarter. (See Figures 4 and 5 below for calculations and reconciliations of OIBDA and OIBDA margin.)
The increased net loss of $63 million compared to a net loss of $32 million in the prior-year quarter is largely attributable to an increase in tax expense partially offset by a decline in interest expense to $47 million from $56 million as a result of the company’s November 2012 refinancing and the re-pricing of our term loan facility in May 2013.
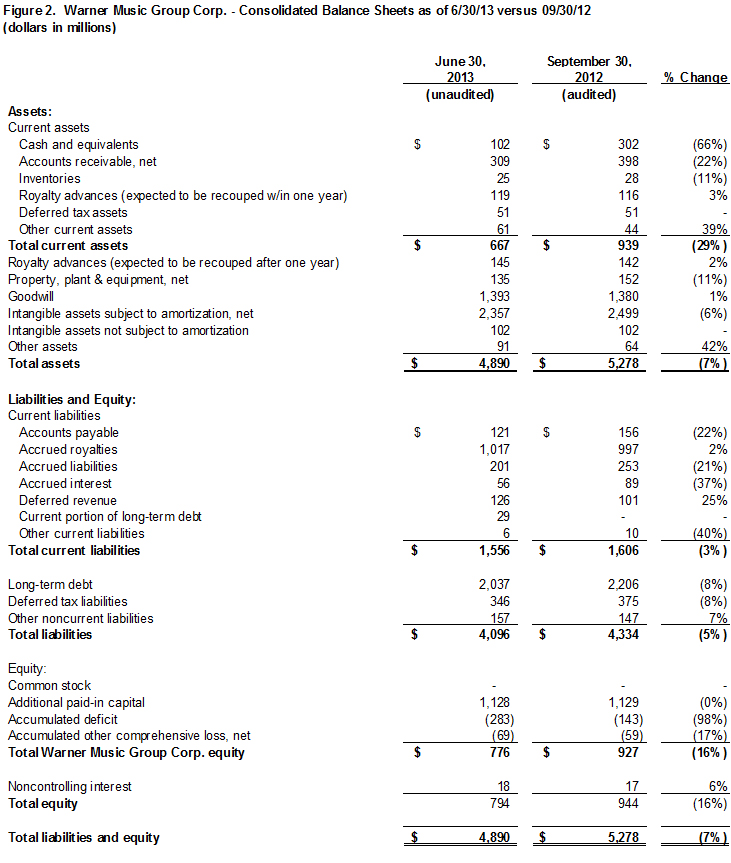
As of June 30, 2013, the company reported a cash balance of $102 million, total debt of $2.066 billion and net debt (total debt minus cash) of $1.964 billion.
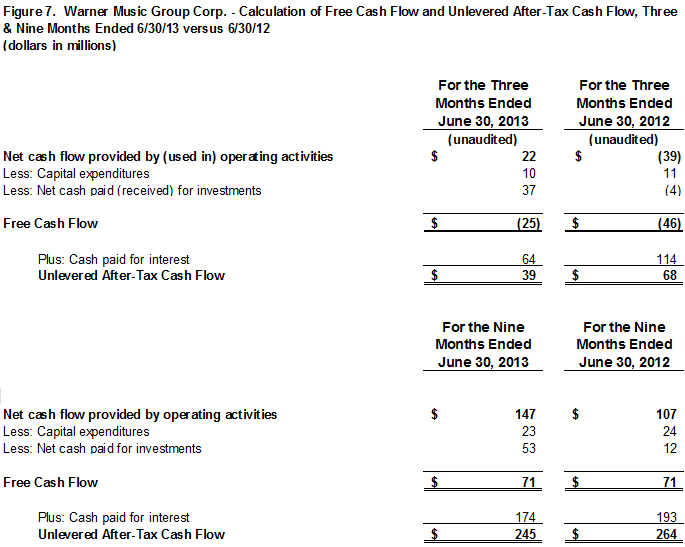
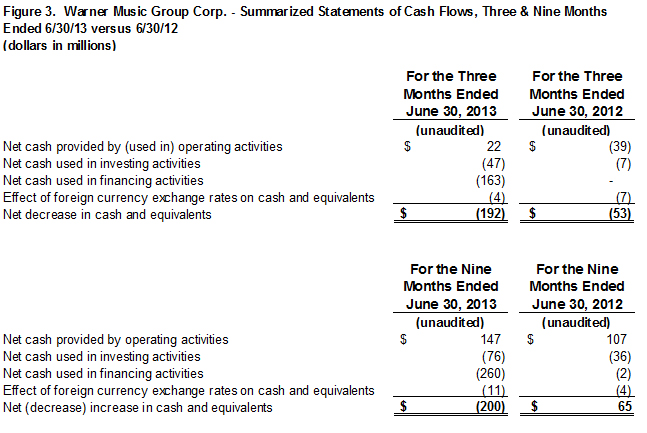
Cash provided by operating activities was $22 million compared to cash used for operating activities of $39 million in the prior-year quarter. Free Cash Flow was negative $25 million compared to negative $46 million in the prior-year quarter. The largest driver of the improvement in cash provided by operating activities and Free Cash Flow was a reduction in cash interest to $64 million in the quarter from $114 million in the prior-year quarter. The increase in cash provided by operating activities was offset by an increase in cash used for investment in recorded music and music publishing assets including the Gala Records Group and Lionsgate acquisitions. (See Figure 7 below for a calculation and reconciliation of Free Cash Flow.)
Recorded Music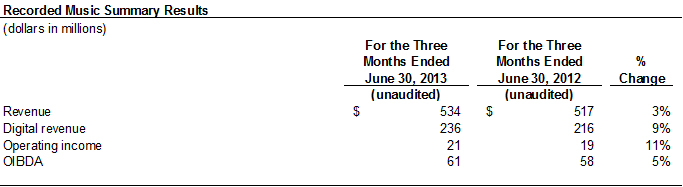
Recorded Music revenue grew 3.3%, or 5.3% on a constant-currency basis. Physical revenue was down 5.8% and digital revenue was up 9.3%. Digital revenue growth reflects an increase in both subscription and streaming revenue and download revenue. Digital revenue growth more than offset the decline in physical revenue. Artist Services and Expanded-Rights revenue rose 17.2% primarily due to the timing of tour schedules in Europe and Asia Pacific. Licensing revenue was down 3.7% in the quarter.
Recorded Music digital revenue represented 44.2% of total Recorded Music revenue, compared to 41.8% in the prior-year quarter. U.S. Recorded Music digital revenue was $130 million, or 57.8% of total U.S. Recorded Music revenue of $225 million, compared to 54.5% in the prior-year quarter. While U.S. Recorded Music revenue was flat, international revenue rose 5.5% led by growth in the U.K., France and Latin America and offset by declines in Canada, Central Europe and parts of Asia. Top sellers in the quarter included Michael Bublé, Bruno Mars, Paramore, Wale, Kyary Pamyu Pamyu, Christophe Maé, Rudimental and Blake Shelton, among others.
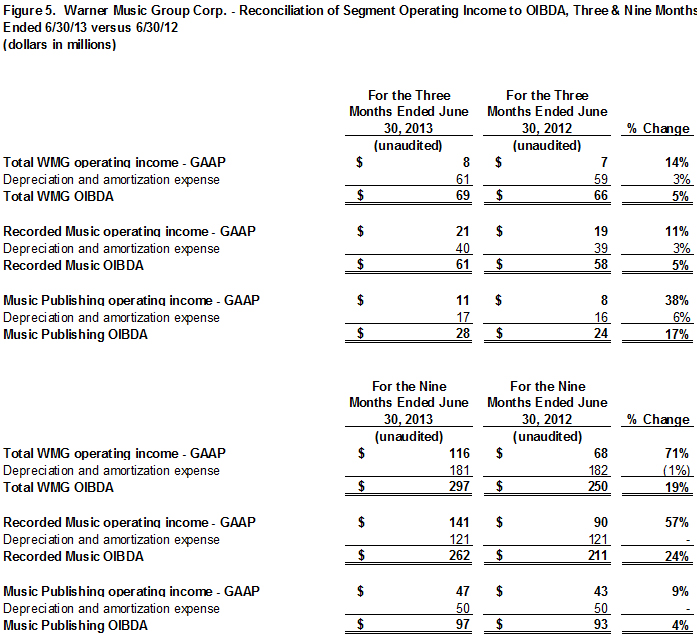
Recorded Music operating margin was up 0.2 percentage points to 3.9% from 3.7% in the prior-year quarter. Recorded Music OIBDA margin rose 0.2 percentage points to 11.4% from 11.2% in the prior-year quarter. OIBDA and OIBDA margin rose due to higher revenue driven by digital growth, and a decrease in selling, general and administrative expense due to cost-saving initiatives, lower variable compensation and lower severance charges in the current period, partially offset by higher cost of revenue.
Music Publishing
Music Publishing revenue declined 2.9%, and 2.2% on a constant-currency basis. Digital revenue grew 46.7%, driven by increases in both subscription and streaming revenue and download revenue. Performance revenue fell 5.6%. The expected decline in mechanical revenue of 2.9% reflects the continued transition from physical to digital sales in the recorded music business, and the majority of the 16.1% decline in synchronization revenue reflects a one-time settlement of $4 million in the prior-year.
Music Publishing operating margin expanded 2.4 percentage points to 8.2% from 5.8% in the prior-year quarter. Music Publishing OIBDA margin increased 3.5 percentage points to 20.9% from 17.4% in the prior-year quarter reflecting a favorable shift toward revenue from higher-margin deals and a decline in selling, general and administrative expense due to lower variable compensation.
Financial details for the quarter can be found in the company’s current Form 10-Q, for the period ended June 30, 2013, filed today with the Securities and Exchange Commission.
This morning, management will be hosting a conference call to discuss the results at 8:30 A.M. EST. The call will be webcast on www.wmg.com.
About Warner Music Group
With its broad roster of new stars and legendary artists, Warner Music Group is home to a collection of the best-known record labels in the music industry including Asylum, Atlantic, Big Beat, East West, Elektra, Erato, Fueled by Ramen, Nonesuch, Parlophone, Reprise, Rhino, Roadrunner, Rykodisc, Sire, Warner Bros., Warner Classics, Warner Music Nashville, and Word, as well as Warner/Chappell Music, one of the world’s leading music publishers, with a catalog of more than one million copyrights worldwide.
“Safe Harbor” Statement under Private Securities Litigation Reform Act of 1995
This communication includes forward-looking statements that reflect the current views of Warner Music Group about future events and financial performance. Words such as “estimates,” “expects,” “anticipates,” “projects,” “plans,” “intends,” “believes,” “forecasts” and variations of such words or similar expressions that predict or indicate future events or trends, or that do not relate to historical matters, identify forward-looking statements. All forward-looking statements are made as of today, and we disclaim any duty to update such statements. Our expectations, beliefs and projections are expressed in good faith and we believe there is a reasonable basis for them. However, we cannot assure you that management’s expectations, beliefs and projections will result or be achieved. Investors should not rely on forward-looking statements because they are subject to a variety of risks, uncertainties, and other factors that could cause actual results to differ materially from our expectations. Please refer to our Form 10-K, Form 10-Qs and our other filings with the U.S. Securities and Exchange Commission concerning factors that could cause actual results to differ materially from those described in our forward-looking statements.
We maintain an Internet site at www.wmg.com. We use our website as a channel of distribution of material company information. Financial and other material information regarding Warner Music Group is routinely posted on and accessible at https://investors.wmg.com. In addition, you may automatically receive email alerts and other information about Warner Music Group by enrolling your email by visiting the “email alerts” section at https://investors.wmg.com. Our website and the information posted on it or connected to it shall not be deemed to be incorporated by reference into this communication.
Supplemental Disclosures Regarding Non-GAAP Financial Measures
We evaluate our operating performance based on several factors, including the following non-GAAP financial measures:
OIBDA
OIBDA reflects our operating income before non-cash depreciation of tangible assets and non-cash amortization of intangible assets. We consider OIBDA to be an important indicator of the operational strengths and performance of our businesses, and believe the presentation of OIBDA helps improve the ability to understand our operating performance and evaluate our performance in comparison to comparable periods. However, a limitation of the use of OIBDA as a performance measure is that it does not reflect the periodic costs of certain capitalized tangible and intangible assets used in generating revenue in our businesses. Accordingly, OIBDA should be considered in addition to, not as a substitute for, operating income, net loss and other measures of financial performance reported in accordance with GAAP. In addition, OIBDA, as we calculate it, may not be comparable to similarly titled measures employed by other companies.
Constant Currency
Because exchange rates are an important factor in understanding period-to-period comparisons, we believe the presentation of revenue on a constant-currency basis in addition to reported revenue helps improve the ability to understand our operating results and evaluate our performance in comparison to prior periods. Constant-currency information compares results between periods as if exchange rates had remained constant period over period. We use results on a constant-currency basis as one measure to evaluate our performance. We calculate constant-currency results by applying current-year foreign currency exchange rates to prior-year results.
However, a limitation of the use of the constant-currency results as a performance measure is that it does not reflect the impact of exchange rates on our revenue, including, for example, the $11 million, $10 million and $1 million unfavorable impact of exchange rates on our Total, Recorded Music and Music Publishing revenue, in the three months ended June 30, 2013 compared to the prior-year quarter. These results should be considered in addition to, not as a substitute for, results reported in accordance with GAAP. Results on a constant-currency basis, as we present them, may not be comparable to similarly titled measures used by other companies and are not a measure of performance presented in accordance with GAAP.
Free Cash Flow
Free Cash Flow reflects our cash flow provided by (used in) operating activities less capital expenditures and cash paid or received for investments. We use Free Cash Flow, among other measures, to evaluate our operating performance. Management believes Free Cash Flow provides investors with an important perspective on the cash available to service debt, fund ongoing operations and working capital needs, make strategic acquisitions and investments and pay any dividends or fund any repurchases of our outstanding notes or common stock in open market purchases, privately negotiated purchases or otherwise. As a result, Free Cash Flow is a significant measure of our ability to generate long-term value. It is useful for investors to know whether this ability is being enhanced or degraded as a result of our operating performance. We believe the presentation of Free Cash Flow is relevant and useful for investors because it allows investors to view performance in a manner similar to the method used by management. In addition, Free Cash Flow is also a primary measure used externally by our investors and analysts for purposes of valuation and comparing our operating performance to other companies in our industry.
Because Free Cash Flow is not a measure of performance calculated in accordance with GAAP, Free Cash Flow should not be considered in isolation of, or as a substitute for, net (loss) income as an indicator of operating performance or cash flow provided by (used in) operating activities as a measure of liquidity. Free Cash Flow, as we calculate it, may not be comparable to similarly titled measures employed by other companies. In addition, Free Cash Flow does not necessarily represent funds available for discretionary use and is not necessarily a measure of our ability to fund our cash needs. Because Free Cash Flow deducts capital expenditures and cash paid or received for investments from “cash flow provided by (used in) operating activities” (the most directly comparable GAAP financial measure), users of this information should consider the types of events and transactions that are not reflected. We provide below a reconciliation of Free Cash Flow to the most directly comparable amount reported under GAAP, which is “net cash flow provided by (used in) operating activities.”
Unlevered After-Tax Cash Flow
Free Cash Flow includes cash paid for interest. We also review our cash flow adjusted for cash paid for interest, a measure we call Unlevered After-Tax Cash Flow. Management believes this measure provides investors with an additional important perspective on our cash generation ability. We consider Unlevered After-Tax Cash Flow to be an important indicator of the performance of our businesses and believe the presentation is relevant and useful for investors because it allows investors to view performance in a manner similar to the method used by management. A limitation of the use of this measure is that it does not reflect the charges for cash interest and, therefore, does not necessarily represent funds available for discretionary use, and is not necessarily a measure of our ability to fund our cash needs. Accordingly, this measure should be considered in addition to, not as a substitute for, net cash flow provided by (used in) operating activities and other measures of liquidity reported in accordance with GAAP.