- Total revenue grew 7% on a constant-currency basis
- Digital revenue increased 14% on a constant-currency basis
- Recorded Music revenue was up 8% on a constant-currency basis
- OIBDA was $102 million versus $93 million in the prior-year quarter
- Net loss was $41 million versus $36 million in the prior-year quarter
Warner Music Group Corp. today announced its first-quarter results for the period ended December 31, 2014.
“Some strong new releases, as well as outstanding execution by our operators around the world during the holiday season, made for an excellent start to our fiscal year,” said Stephen Cooper, Warner Music Group’s CEO. “Our extraordinary roster of songwriters and artists, combined with our first-class management team and our sustained investment in new opportunities, means that we are well-positioned to build on this success as the industry evolves.”
“We are pleased with our top line performance as well as our improved free cash flow,” added Eric Levin, Warner Music Group’s Executive Vice President and CFO. “We remain keenly focused on growth and managing our expenses.”
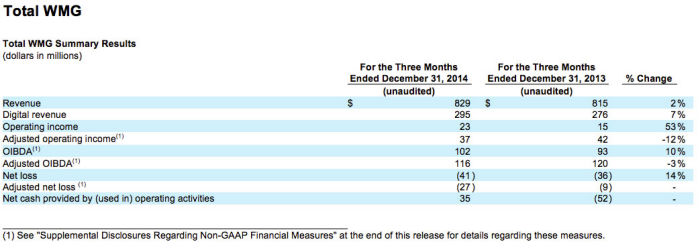
Revenue grew 1.7% (or 6.6% in constant currency), driven by strong holiday sales. On a constant-currency basis, physical revenue grew in Recorded Music and digital revenue grew in Recorded Music and Music Publishing. This growth was partially offset by a slight decline in Artist Services and Expanded-Rights revenue and declines across performance, mechanical and synchronization revenue in Music Publishing. Recorded Music licensing revenue was flat. Constant-currency revenue growth was widespread across geographies with growth in the U.S., the UK, Continental Europe, Latin America and China partially offset by declines in Japan. Digital revenue grew 6.9% (or 14.3% in constant currency), and digital revenue represented 35.6% of total revenue, compared to 33.9% in the prior-year quarter. Growth in digital revenue was predominantly driven by streaming, although download revenue was also up modestly.
Operating income was $23 million compared to $15 million in the prior-year quarter. OIBDA increased 10% to $102 million from $93 million in the prior-year quarter and OIBDA margin rose to 12.3% from 11.4% in the prior-year quarter. The increase in operating income, OIBDA and OIBDA margin is largely the result of the increase in revenue driven by strong holiday sales and lower PLG-related expenses. Adjusted OIBDA declined 3.3% and Adjusted OIBDA margin declined 0.7 percentage points to 14.0% from 14.7%. The decline in Adjusted OIBDA reflects higher investment in marketing as well as changes in revenue mix. Adjusted operating margin declined 0.7 percentage points to 4.5% from 5.2% driven by the same factors that impacted Adjusted OIBDA.
Net loss was $41 million compared to $36 million in the prior-year quarter. Net loss was higher as a result of increased income tax expense due to losses in some countries for which no tax benefit could be realized.
Adjusted operating income, Adjusted OIBDA and Adjusted net loss exclude the impact of PLG-related expenses, other cost-saving initiatives and expenses related to moving the company’s corporate headquarters. See below for calculations and reconciliations of OIBDA, Adjusted operating income, Adjusted OIBDA and Adjusted net loss.
As of December 31, 2014, the company reported a cash balance of $145 million, total debt of $3.018 billion and net debt (total long-term debt, including the current portion, minus cash) of $2.873 billion. There was no balance outstanding on the company’s revolver at the end of the quarter.
Cash provided by operating activities was $35 million compared to cash used in operating activities of $52 million in the prior-year quarter. The change is largely a result of lower cash interest payments and of working capital improvements, some of which are timing related, partially offset by the final purchase price payment related to the PLG acquisition. Free Cash Flow, defined below, was negative $2 million compared to negative $78 million in the prior-year quarter, reflecting the improvements in cash provided by operating activities partially offset by an increase in expenses related to moving the company’s corporate headquarters.
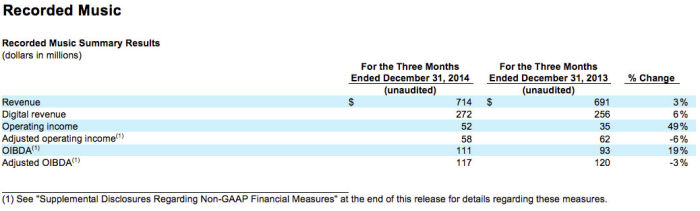
Recorded Music revenue grew 3.3% (or 8.3% in constant currency), driven by strong holiday sales. Strength in physical and digital revenue was partially offset by a decline in licensing and Artist Services and Expanded-Rights revenue. Physical revenue growth was driven by releases from Pink Floyd and Johnny Hallyday, artists who traditionally have a higher proportion of physical sales, as well as the continued success of Ed Sheeran. Digital growth reflects a continuing industry transition characterized by strength in streaming revenue. The decline in Artist Services and Expanded-Rights revenue was due to the timing of European concert tours. Recorded Music saw strength around the globe with Japan the most significant exception. Domestic Recorded Music digital revenue was $132 million or 54.8% of total domestic Recorded Music revenue. Major sellers included Ed Sheeran, Pink Floyd, Johnny Hallyday, David Guetta and Slipknot.
Recorded Music operating income was $52 million up from $35 million in the prior-year quarter and operating margin was up 2.2 percentage points to 7.3% versus 5.1% in the prior-year quarter. Adjusted operating margin declined 0.9 percentage points to 8.1% from 9.0% in the prior-year quarter. OIBDA rose to $111 million from $93 million in the prior-year quarter and OIBDA margin rose 2.0 percentage points to 15.5%. Adjusted OIBDA was $117 million versus $120 million in the prior-year quarter with Adjusted OIBDA margin down 1.0 percentage point to 16.4%. The declines in Adjusted OIBDA and Adjusted OIBDA margin were driven by higher investment in marketing as well as changes in revenue mix partially offset by lower PLG-related expenses.
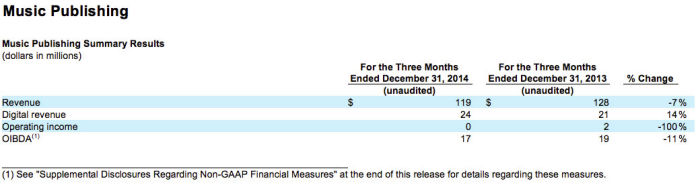
Music Publishing revenue declined 7.0% or 3.3% in constant currency. Declines in performance, mechanical and synchronization revenue were partially offset by strength in digital revenue. Digital revenue grew 14.3%. Performance revenue was down 11.8%, driven by timing of collection society distributions and mechanical revenue declined 14.8%, driven by the ongoing industry shift from physical to digital sales. Synchronization revenue was down 3.8%.
Music Publishing operating margin declined 1.6 percentage points to 0.0% from 1.6% in the prior-year quarter, as a result of the revenue decline. Music Publishing OIBDA declined by $2 million or 10.5% to $17 million, while Music Publishing OIBDA margin declined 0.5 percentage points to 14.3% from 14.8% also as a result of the revenue decline.
Financial details for the quarter can be found in the company’s current Form 10-Q, for the period ended December 31, 2014, filed today with the Securities and Exchange Commission.
This morning, management will be hosting a conference call to discuss the results at 8:30 A.M. EST. The call will be webcast on www.wmg.com.
About Warner Music Group
With its broad roster of new stars and legendary artists, Warner Music Group is home to a collection of the best-known record labels in the music industry including Asylum, Atlantic, Big Beat, East West, Elektra, Erato, Fueled by Ramen, Nonesuch, Parlophone, Reprise, Rhino, Roadrunner, Rykodisc, Sire, Warner Bros., Warner Classics, Warner Music Nashville and Word, as well as Warner/Chappell Music, one of the world’s leading music publishers, with a catalog of more than one million copyrights worldwide.
“Safe Harbor” Statement under Private Securities Litigation Reform Act of 1995
This communication includes forward-looking statements that reflect the current views of Warner Music Group about future events and financial performance. Words such as “estimates,” “expects,” “anticipates,” “projects,” “plans,” “intends,” “believes,” “forecasts” and variations of such words or similar expressions that predict or indicate future events or trends, or that do not relate to historical matters, identify forward-looking statements. All forward-looking statements are made as of today, and we disclaim any duty to update such statements. Our expectations, beliefs and projections are expressed in good faith and we believe there is a reasonable basis for them. However, we cannot assure you that management’s expectations, beliefs and projections will result or be achieved. Investors should not rely on forward-looking statements because they are subject to a variety of risks, uncertainties, and other factors that could cause actual results to differ materially from our expectations. Please refer to our Form 10-K, Form 10-Qs and our other filings with the U.S. Securities and Exchange Commission concerning factors that could cause actual results to differ materially from those described in our forward-looking statements.
We maintain an Internet site at www.wmg.com. We use our website as a channel of distribution of material company information. Financial and other material information regarding Warner Music Group is routinely posted on and accessible at https://investors.wmg.com. In addition, you may automatically receive email alerts and other information about Warner Music Group by enrolling your email address through the “email alerts” section at https://investors.wmg.com. Our website and the information posted on it or connected to it shall not be deemed to be incorporated by reference into this communication.
Basis of Presentation
The Company maintains a 52-53 week fiscal year ending on the last Friday in each reporting period. As such, all references to December 31, 2014 and December 31, 2013 relate to the three-month periods ended December 26, 2014 and December 27, 2013, respectively. For convenience purposes, the Company continues to date its financial statements as of December 31. The fiscal year ended September 30, 2014 ended on September 26, 2014. For convenience purposes, the Company continues to date its balance sheet as of September 30.


Supplemental Disclosures Regarding Non-GAAP Financial Measures
We evaluate our operating performance based on several factors, including the following non-GAAP financial measures:
OIBDA
OIBDA reflects our operating income before non-cash depreciation of tangible assets and non-cash amortization of intangible assets. We consider OIBDA to be an important indicator of the operational strengths and performance of our businesses, and believe the presentation of OIBDA helps improve the ability to understand our operating performance and evaluate our performance in comparison to comparable periods. However, a limitation of the use of OIBDA as a performance measure is that it does not reflect the periodic costs of certain capitalized tangible and intangible assets used in generating revenue in our businesses. Accordingly, OIBDA should be considered in addition to, not as a substitute for, operating income (loss), net income (loss) and other measures of financial performance reported in accordance with U.S. GAAP. In addition, OIBDA, as we calculate it, may not be comparable to similarly titled measures employed by other companies.


Adjusted Operating Income, Adjusted OIBDA and Adjusted Net Loss
Adjusted operating income, Adjusted OIBDA and Adjusted net (loss) income is operating income, OIBDA and net loss, respectively, adjusted to exclude the impact of certain items that affect comparability. Factors affecting period-to-period comparability of the unadjusted measures in the quarter included the items listed in Figure 6 below. We use Adjusted operating income, Adjusted OIBDA and Adjusted net loss to evaluate our actual operating performance. We believe that the adjusted results provide relevant and useful information for investors because they clarify our actual operating performance, make it easier to compare our results with those of other companies in our industry and allow investors to review performance in the same way as our management. Since these are not measures of performance calculated in accordance with U.S. GAAP, they should not be considered in isolation of, or as a substitute for, operating income, OIBDA and net loss attributable to Warner Music Group Corp. as indicators of operating performance, and they may not be comparable to similarly titled measures employed by other companies.

Constant Currency
Because exchange rates are an important factor in understanding period-to-period comparisons, we believe the presentation of revenue on a constant-currency basis in addition to reported revenue helps improve the ability to understand our operating results and evaluate our performance in comparison to prior periods. Constant-currency information compares results between periods as if exchange rates had remained constant period over period. We use results on a constant-currency basis as one measure to evaluate our performance. We calculate constant-currency results by applying current-year foreign currency exchange rates to prior-year results. However, a limitation of the use of the constant-currency results as a performance measure is that it does not reflect the impact of exchange rates on our revenue. These results should be considered in addition to, not as a substitute for, results reported in accordance with U.S. GAAP. Results on a constant-currency basis, as we present them, may not be comparable to similarly titled measures used by other companies and are not a measure of performance presented in accordance with U.S. GAAP.

Free Cash Flow
Free Cash Flow reflects our cash flow provided by operating activities less capital expenditures and cash paid for investments. We use Free Cash Flow, among other measures, to evaluate our operating performance. Management believes Free Cash Flow provides investors with an important perspective on the cash available to service debt, fund ongoing operations and working capital needs, make strategic acquisitions and investments and pay any dividends, make prepayments of outstanding debt or fund any repurchases of our outstanding debt securities in open market purchases, privately negotiated purchases or otherwise. As a result, Free Cash Flow is a significant measure of our ability to generate long-term value. It is useful for investors to know whether this ability is being enhanced or degraded as a result of our operating performance. We believe the presentation of Free Cash Flow is relevant and useful for investors because it allows investors to view performance in a manner similar to the method management uses.
Because Free Cash Flow is not a measure of performance calculated in accordance with U.S. GAAP, Free Cash Flow should not be considered in isolation of, or as a substitute for, net (loss) income as an indicator of operating performance or cash flow provided by operating activities as a measure of liquidity. Free Cash Flow, as we calculate it, may not be comparable to similarly titled measures employed by other companies. In addition, Free Cash Flow does not necessarily represent funds available for discretionary use and is not necessarily a measure of our ability to fund our cash needs. Because Free Cash Flow deducts capital expenditures and cash paid for investments from “net cash provided by (used in) operating activities” (the most directly comparable U.S. GAAP financial measure), users of this information should consider the types of events and transactions that are not reflected. We provide below a reconciliation of Free Cash Flow to the most directly comparable amount reported under U.S. GAAP, which is “net cash provided by (used in) operating activities.”