•Revenue grew 7% on a constant-currency basis
•Digital Recorded Music revenue increased 9% on a constant-currency basis
•Adjusted OIBDA up 7% with growth in both Recorded Music and Music Publishing
Warner Music Group Corp. today announced its first-quarter financial results for the period ended December 31, 2013.
“There were a number of bright spots this quarter, including strong growth in steaming revenue for our recorded music business and solid performance from our music publishing business,” said Stephen Cooper, Warner Music Group’s CEO. “While we had a light release schedule this quarter, we are enthusiastic about our release schedule for the second half of the fiscal year.”
“We maintained our Adjusted OIBDA margin for the overall business this quarter and expanded our Music Publishing OIBDA margin,” added Brian Roberts, Warner Music Group’s Executive Vice President and CFO. “Additionally, we remain on track with our PLG integration plans.”
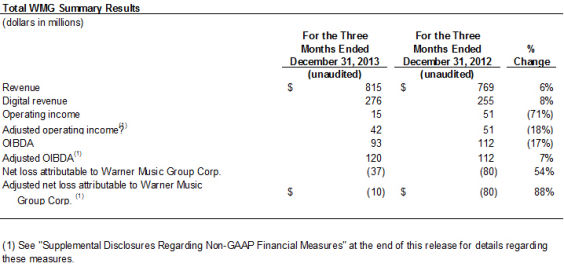
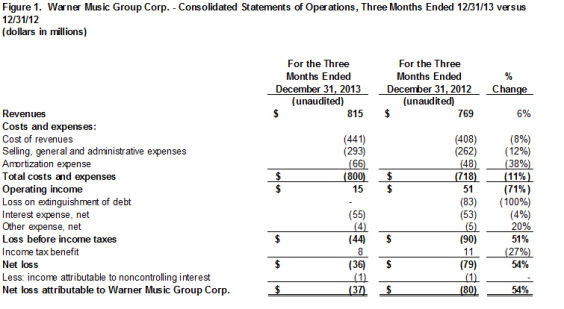
For the quarter, revenue grew 6.0% (or 6.8% in constant currency), driven by the July 1, 2013 acquisition of Parlophone Label Group (“PLG”). Excluding PLG revenue, revenue declined 3.6% (or 2.9% in constant currency), due to a lighter release schedule than in the prior-year quarter. Including PLG, the growth in artist services and expanded rights revenue, Recorded Music licensing revenue, digital revenue and total Music Publishing revenue was partially offset by declines in physical Recorded Music revenue. Constant-currency revenue growth in the U.K., France, Italy, Spain and other parts of Europe, driven in part by the PLG acquisition, was partially offset by declines in the U.S., Canada, Japan and other parts of Asia. Digital revenue grew 8.2% (or 8.7% in constant currency), and digital revenue represented 33.9% of total revenue, compared to 33.2% in the prior-year quarter. Growth in digital revenue reflects the acquisition of PLG, as well as growth in worldwide revenue related to streaming services and international revenue related to download services.
Adjusted operating margin declined 1.4 percentage points to 5.2% from 6.6%. Adjusted OIBDA grew 7.1% and Adjusted OIBDA margin expanded 0.1 percentage points to 14.7% from 14.6%. The increase in Adjusted OIBDA reflects the acquisition of PLG as well as growth in Music Publishing OIBDA. Excluding PLG OIBDA, Adjusted OIBDA declined 10.7% and Adjusted OIBDA margin declined 1.1 percentage points to 13.5%. Operating income, Adjusted operating income, OIBDA and Adjusted OIBDA for the quarter included $1 million of severance charges (approximately $0.7 million in Recorded Music and $0.5 million in Corporate; not including those charges associated with the PLG acquisition) compared to $5 million of severance charges in the prior-year quarter (all in Recorded Music) (the “Quarterly Severance Charges”).
Net loss attributed to Warner Music Group improved to $37 million compared to a loss of $80 million in the prior-year quarter. The prior-year quarter reflects the impact of an $83 million loss on the extinguishment of debt in connection with the company’s November 2012 refinancing of certain indebtedness.
Adjusted operating income, Adjusted OIBDA and Adjusted net income (loss) exclude the impact of expenses relating to the integration of PLG. See below for calculations and reconciliations of OIBDA, Adjusted operating income, Adjusted OIBDA and Adjusted net income (loss).
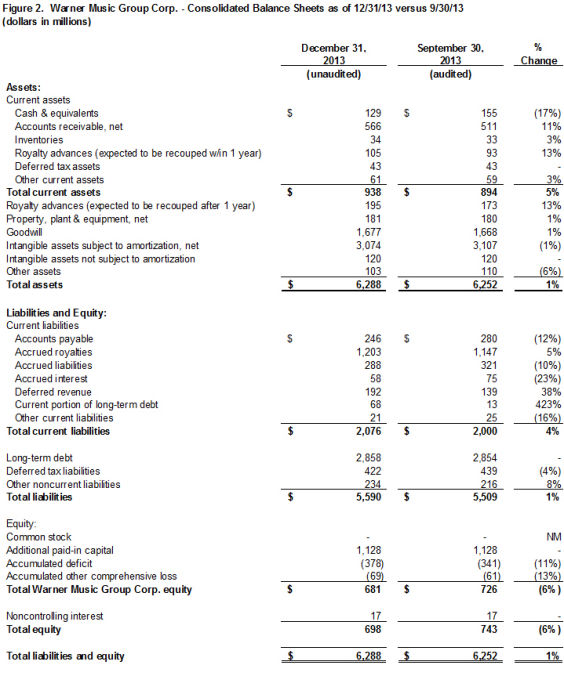
As of December 31, 2013, the company reported a cash balance of $129 million, total long-term debt of $2.926 billion and net debt (total long-term debt, including the current portion, minus cash) of $2.797 billion.
Cash used in operating activities was $52 million compared to $10 million in the prior-year quarter. Typically, the first quarter of each fiscal year has negative operating cash flow due to cash needs associated with artist and repertoire (“A&R”) investments and the seasonality of physical holiday collections. The increase in cash used in operating activities in the quarter primarily reflects the decline in OIBDA, which includes the impact of expenses relating to the integration of PLG, and an increase in receivables, partially offset by lower cash paid for interest. Free Cash Flow, defined below, was negative $78 million compared to negative $25 million in the prior-year quarter, reflecting the increase in cash used in operating activities, as well as an increase in capital expenditures and cash paid for investments.

Recorded Music revenue grew 5.2% (or 6.1% in constant currency), due to the acquisition of PLG. Excluding PLG, revenue declined 6.1% (or 5.2% in constant currency) due to the release schedule. Including PLG, artist services and expanded rights revenue, licensing revenue and digital revenue all grew, but were partially offset by a decline in physical revenue. Artist services and expanded rights revenue growth was driven by an increase in concert promotion revenue, primarily in Italy, France and Germany, as well as the acquisition of PLG. Licensing revenue growth was largely driven by the acquisition of PLG, as well as by new licensing deals and increased broadcast fees. Digital revenue growth of 8.0% (or 8.9% in constant currency) was driven by the acquisition of PLG and represented 37.0% of total Recorded Music revenue, compared to 36.1% in the prior-year quarter. Domestic Recorded Music digital revenue was $123 million, or 53.5% of total domestic Recorded Music revenue. Major sellers included James Blunt, Kobukuro, Bruno Mars, Michael Bublé and Muse.
Recorded Music Adjusted operating margin contracted 2.3 percentage points to 9.0% from 11.3% in the prior-year quarter. Recorded Music Adjusted OIBDA was up 5.3% while Recorded Music Adjusted OIBDA margin remained flat at 17.4%. Excluding PLG, Recorded Music Adjusted OIBDA declined 12.3% and Recorded Music Adjusted OIBDA margin declined 1.2 percentage points to 16.2% due to the release schedule as well as an increase in product costs associated with growth in artist services and expanded rights revenue. Operating income, Adjusted operating income, OIBDA and Adjusted OIBDA reflect the impact of the Quarterly Severance Charges.

Music Publishing revenue grew 10.3% on both an as-reported and constant-currency basis as digital, synchronization, performance and mechanical revenue all grew. Digital revenue grew 10.5% (or 5.0% in constant currency), due to growth in streaming revenue. Synchronization revenue was up 18.2% (or 23.8% in constant currency), reflecting growth in many segments in the U.S. including commercials, movies and videogames. Performance revenue was up 8.5% (or 10.9% in constant currency), and mechanical revenue grew 3.8% on both an as-reported and constant-currency basis, both driven by the timing of collection society distributions.
Music Publishing operating margin improved 2.5 percentage points to 1.6% from negative 0.9% in the prior-year quarter. Music Publishing OIBDA grew 18.8% to $19 million, while Music Publishing OIBDA margin expanded 1.0 percentage point to 14.8% from 13.8% due to revenue mix.
Financial details for the quarter can be found in the company’s current Form 10-Q, for the period ended December 31, 2013, filed today with the Securities and Exchange Commission.
This morning, management will be hosting a conference call to discuss the results at 8:30 A.M. EST. The call will be webcast on www.wmg.com.
About Warner Music Group
With its broad roster of new stars and legendary artists, Warner Music Group is home to a collection of the best-known record labels in the music industry including Asylum, Atlantic, Big Beat, East West, Elektra, Erato, Fueled by Ramen, Nonesuch, Parlophone, Reprise, Rhino, Roadrunner, Rykodisc, Sire, Warner Bros., Warner Classics, Warner Music Nashville and Word, as well as Warner/Chappell Music, one of the world’s leading music publishers, with a catalog of more than one million copyrights worldwide.
“Safe Harbor” Statement under Private Securities Litigation Reform Act of 1995
This communication includes forward-looking statements that reflect the current views of Warner Music Group about future events and financial performance, including, but not limited to, statements regarding the Company’s PLG integration plans. Words such as “estimates,” “expects,” “anticipates,” “projects,” “plans,” “intends,” “believes,” “forecasts” and variations of such words or similar expressions that predict or indicate future events or trends, or that do not relate to historical matters, identify forward-looking statements. All forward-looking statements are made as of today, and we disclaim any duty to update such statements. Our expectations, beliefs and projections are expressed in good faith and we believe there is a reasonable basis for them. However, we cannot assure you that management’s expectations, beliefs and projections will result or be achieved. Investors should not rely on forward-looking statements because they are subject to a variety of risks, uncertainties, and other factors that could cause actual results to differ materially from our expectations. Please refer to our Form 10-K, Form 10-Qs and our other filings with the U.S. Securities and Exchange Commission concerning factors that could cause actual results to differ materially from those described in our forward-looking statements.
We maintain an Internet site at www.wmg.com. We use our website as a channel of distribution of material company information. Financial and other material information regarding Warner Music Group is routinely posted on and accessible at https://investors.wmg.com. In addition, you may automatically receive email alerts and other information about Warner Music Group by enrolling your email by visiting the “email alerts” section at https://investors.wmg.com. Our website and the information posted on it or connected to it shall not be deemed to be incorporated by reference into this communication.

Supplemental Disclosures Regarding Non-GAAP Financial Measures
We evaluate our operating performance based on several factors, including the following non-GAAP financial measures:
OIBDA
OIBDA reflects our operating income before non-cash depreciation of tangible assets and non-cash amortization of intangible assets. We consider OIBDA to be an important indicator of the operational strengths and performance of our businesses, and believe the presentation of OIBDA helps improve the ability to understand our operating performance and evaluate our performance in comparison to comparable periods. However, a limitation of the use of OIBDA as a performance measure is that it does not reflect the periodic costs of certain capitalized tangible and intangible assets used in generating revenue in our businesses. Accordingly, OIBDA should be considered in addition to, not as a substitute for, operating income, net (loss) income and other measures of financial performance reported in accordance with U.S. GAAP. In addition, OIBDA, as we calculate it, may not be comparable to similarly titled measures employed by other companies.


Adjusted Operating Income, Adjusted OIBDA and Adjusted Net (Loss) Income
Adjusted operating income, Adjusted OIBDA and Adjusted net (loss) income is operating income, OIBDA and net (loss) income, respectively, adjusted to exclude the impact of certain items that affect comparability (“Factors Affecting Comparability”). Factors affecting period-to-period comparability of the unadjusted measures in fiscal year 2014 included the acquisition and integration expenses related to our acquisition of PLG, which existed in fiscal year 2014 but not 2013. We use Adjusted operating income, Adjusted OIBDA and Adjusted net (loss) income to evaluate our actual operating performance. We believe that the adjusted results provide relevant and useful information for investors because they clarify our actual operating performance, make it easier to compare our results with those of other companies in our industry and allow investors to review performance in the same way as our management. Since these are not measures of performance calculated in accordance with U.S. GAAP, they should not be considered in isolation of, or as a substitute for, operating income, OIBDA and net loss attributable to WMG as indicators of operating performance, and they may not be comparable to similarly titled measures employed by other companies.

Constant Currency
Because exchange rates are an important factor in understanding period-to-period comparisons, we believe the presentation of revenue on a constant-currency basis in addition to reported revenue helps improve the ability to understand our operating results and evaluate our performance in comparison to prior periods. Constant-currency information compares results between periods as if exchange rates had remained constant period over period. We use results on a constant-currency basis as one measure to evaluate our performance. We calculate constant-currency results by applying current-year foreign currency exchange rates to prior-year results. However, a limitation of the use of the constant-currency results as a performance measure is that it does not reflect the impact of exchange rates on our revenue, including, for example, the $6 million unfavorable impact of exchange rates on our Total and Recorded Music revenue, in the three months ended December 31, 2013 compared to the prior-year quarter. These results should be considered in addition to, not as a substitute for, results reported in accordance with U.S. GAAP. Results on a constant-currency basis, as we present them, may not be comparable to similarly titled measures used by other companies and are not a measure of performance presented in accordance with U.S. GAAP.

Free Cash Flow
Free Cash Flow reflects our cash flow used in operating activities less capital expenditures and cash paid for investments. We use Free Cash Flow, among other measures, to evaluate our operating performance. Management believes Free Cash Flow provides investors with an important perspective on the cash available to service debt, fund ongoing operations and working capital needs, make strategic acquisitions and investments and pay any dividends or fund any repurchases of our outstanding notes or common stock in open market purchases, privately negotiated purchases or otherwise. As a result, Free Cash Flow is a significant measure of our ability to generate long-term value. It is useful for investors to know whether this ability is being enhanced or degraded as a result of our operating performance. We believe the presentation of Free Cash Flow is relevant and useful for investors because it allows investors to view performance in a manner similar to the method used by management. In addition, Free Cash Flow is also a primary measure used externally by our investors and analysts for purposes of valuation and comparing our operating performance to other companies in our industry.
Because Free Cash Flow is not a measure of performance calculated in accordance with U.S. GAAP, Free Cash Flow should not be considered in isolation of, or as a substitute for, net (loss) income as an indicator of operating performance or cash flow used in operating activities as a measure of liquidity. Free Cash Flow, as we calculate it, may not be comparable to similarly titled measures employed by other companies. In addition, Free Cash Flow does not necessarily represent funds available for discretionary use and is not necessarily a measure of our ability to fund our cash needs. Because Free Cash Flow deducts capital expenditures and cash paid for investments from “cash flow used in operating activities” (the most directly comparable U.S. GAAP financial measure), users of this information should consider the types of events and transactions that are not reflected. We provide below a reconciliation of Free Cash Flow to the most directly comparable amount reported under U.S. GAAP, which is “net cash flow used in operating activities.”