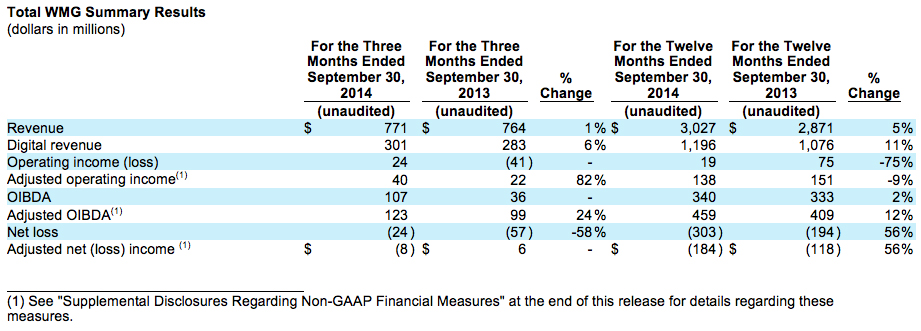
- Total revenue increased 5.2% for the full year or was flat for the quarter on a constant-currency basis
- Digital revenue increased 10.9% for the full year or 9.9% for the quarter on a constant-currency basis
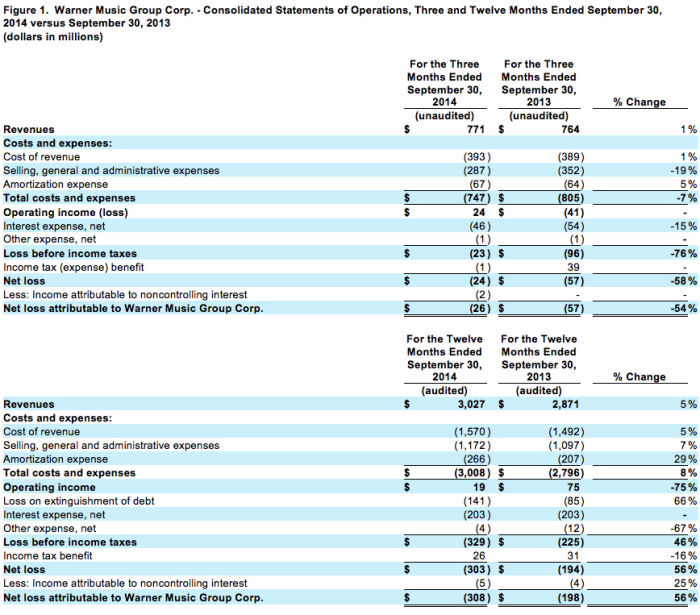
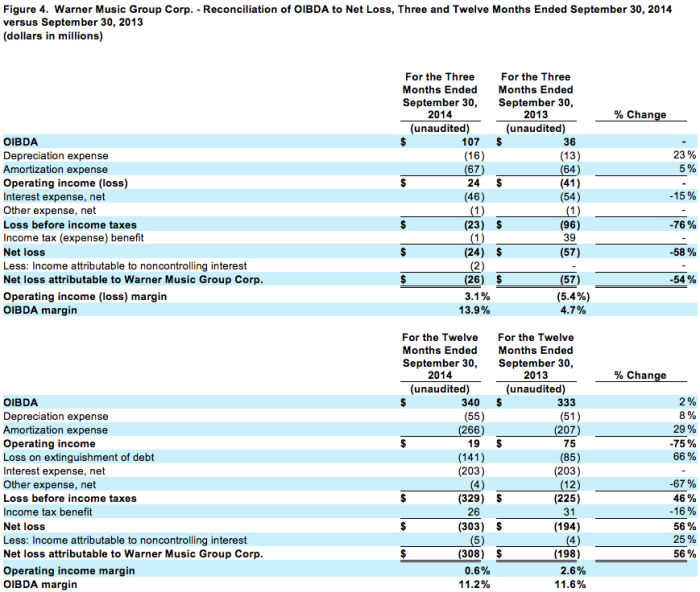
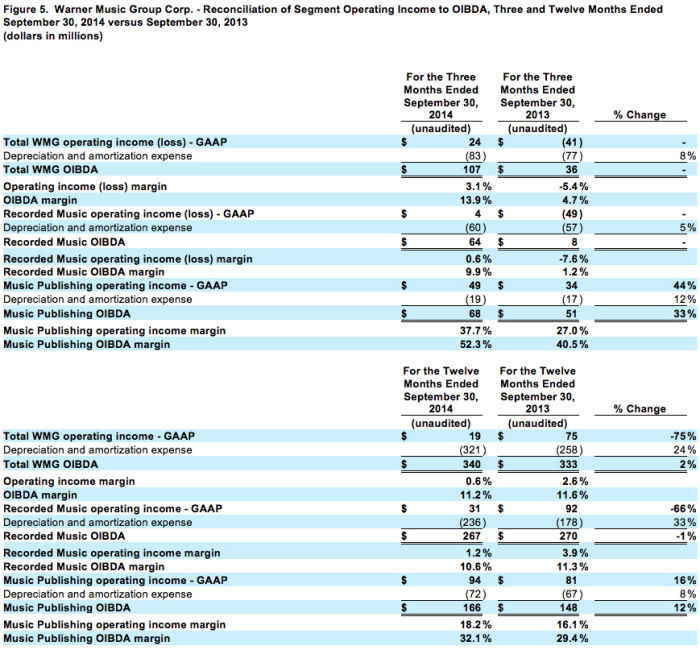
- OIBDA was $107 million versus $36 million in the prior-year quarter
- Net loss was $24 million versus $57 million in the prior-year quarter
Warner Music Group Corp. (“WMG”) today announced its fourth-quarter and full-year financial results for the period ended September 30, 2014.
“We are proud of everything we accomplished this year,” said Stephen Cooper, Warner Music Group’s CEO. “We had great success with artists at all stages of their careers, breaking amazing new talent as well as taking our established roster to new heights. At the same time we expanded our digital footprint, announced several groundbreaking partnerships and pushed into emerging markets, ensuring we are well positioned to capitalize on future growth opportunities as the industry evolves and streaming services achieve scale.”
“We improved our financial flexibility this year by lowering interest cost with our April refinancing and we continue to look for new and innovative opportunities to generate revenue and cost savings,” added Eric Levin, Warner Music Group’s Executive Vice President and CFO.
Fourth-Quarter Results
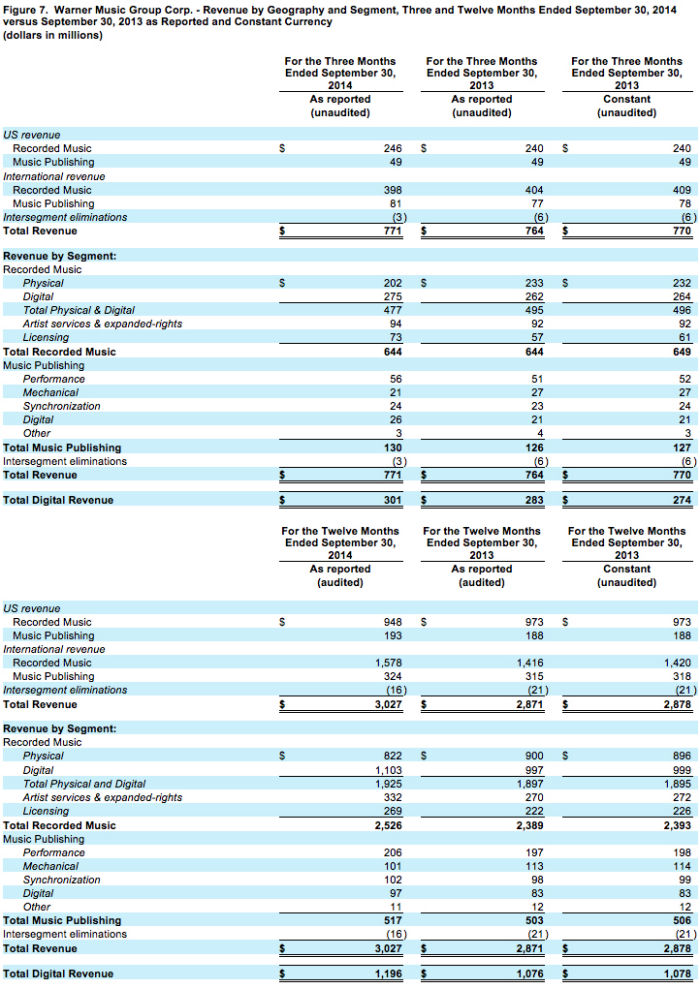
For the quarter, total revenue grew 0.9% or 0.1% in constant currency. Domestic total revenue rose 2.1% and international total revenue declined 0.4% or 1.6% on a constant-currency basis. Prior to intersegment eliminations, domestic and international total revenue represented 38.1% and 61.9% of total revenue, respectively, compared to 37.5% and 62.5% of total revenue, respectively, in the prior-year quarter. Recorded Music revenue grew in digital, licensing and artist services and expanded-rights and Music Publishing revenue grew in digital, synchronization and performance, which offset continued softness in Recorded Music physical revenue and Music Publishing mechanical revenue. Recorded Music revenue growth in the U.S., UK, Germany and Italy was partially offset by revenue declines in markets including Japan and France. Digital revenue grew 6.4% or 9.9% in constant currency, and digital revenue represented 39.0% of total revenue for the quarter, compared to 37.0% in the prior-year quarter. Growth in digital revenue is driven by the growth in streaming services.
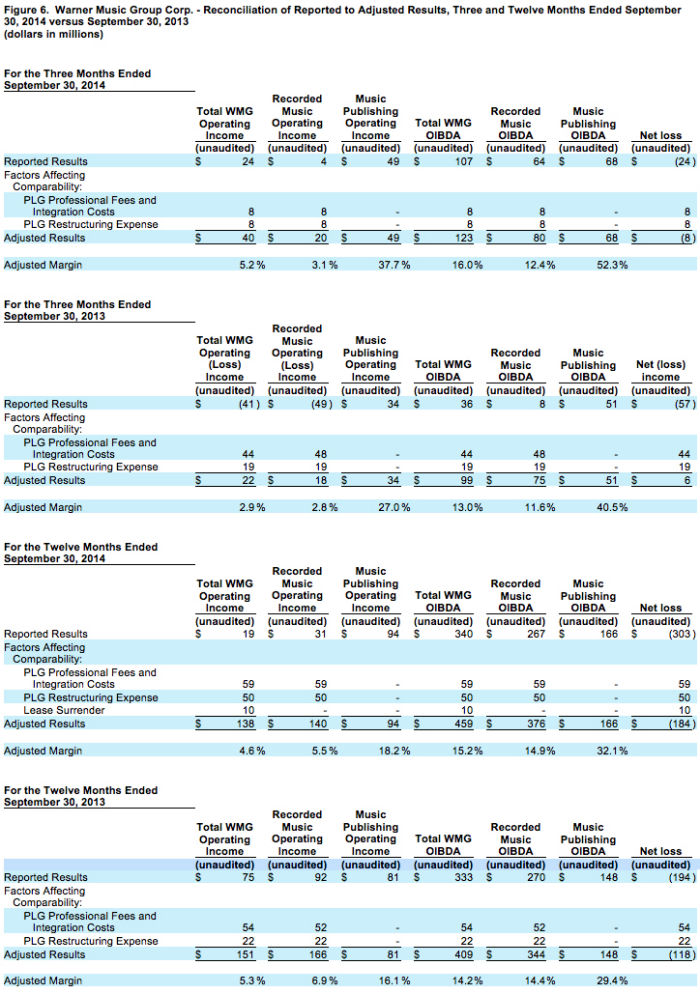
For the quarter, operating income was $24 million compared to operating loss of $41 million in the prior-year quarter. OIBDA increased to $107 million from $36 million in the prior-year quarter and OIBDA margin rose to 13.9% from 4.7% in the prior-year quarter. The increase in operating income, OIBDA and OIBDA margin is largely the result of lower costs related to the Parlophone Label Group (PLG) acquisition in the current-year quarter. Adjusted OIBDA, which excludes PLG-related costs, was $123 million versus $99 million in the prior-year quarter and adjusted OIBDA margin was 16.0% compared to 13.0% in the prior-year quarter. The increase in adjusted OIBDA margin was in part related to a reduction in PLG operating overhead in fiscal 2014 as cost savings and synergies were realized. Adjusted operating margin rose 2.3 percentage points to 5.2% from 2.9%.
Net loss was $24 million compared to $57 million in the prior-year quarter and adjusted net loss was $8 million compared to adjusted net income of $6 million in the prior-year quarter. Adjusted operating income, adjusted OIBDA and adjusted net income (loss) exclude the impact of items relating to the PLG acquisition. See below for calculations and reconciliations of OIBDA, adjusted operating income, adjusted OIBDA and adjusted net income (loss).
<!–[endif]–>
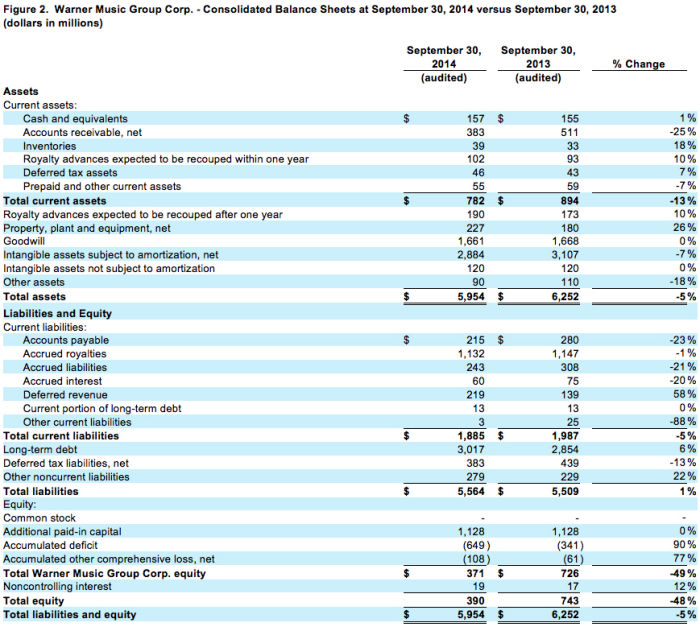
As of September 30, 2014, the company reported a cash and equivalents balance of $157 million, total long-term debt of $3.030 billion and net debt (total debt minus cash) of $2.873 billion. There was no balance outstanding on the company’s revolver at the end of the quarter.
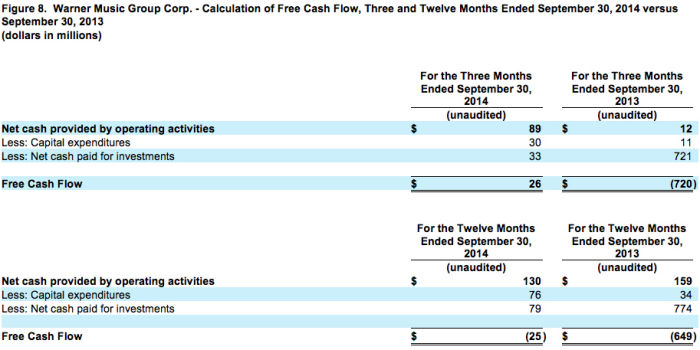
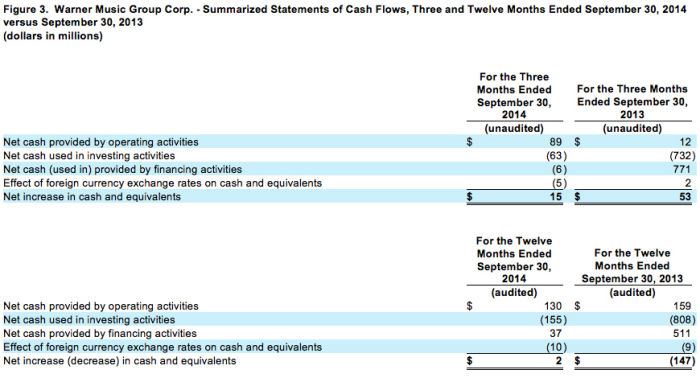
Cash provided by operating activities was $89 million compared to $12 million in the prior-year quarter. The increase in cash provided by operating activities primarily reflects an increase related to the timing of digital advances in the quarter. Free Cash Flow, defined below, was $26 million compared to negative $720 million in the prior-year quarter. The largest factor impacting the year-over-year change in Free Cash Flow was the PLG acquisition, which was completed in the prior-year quarter. Capital expenditures rose to $30 million versus $11 million in the prior-year quarter, primarily as a result of costs incurred in the current quarter associated with moving the company’s headquarters.
Full-Year Results
For the fiscal year, total revenue grew 5.4% or 5.2% in constant currency. Growth was driven by the addition of PLG, increases in Recorded Music digital and licensing revenue and artist services and expanded-rights revenue as well as Music Publishing digital, performance and synchronization revenue. These gains more than offset declines in Recorded Music physical revenue and Music Publishing mechanical revenue. Excluding PLG, total revenue declined 3.7% or 3.8% on a constant-currency basis. Domestic total revenue declined 1.7% and international total revenue rose 9.9% or 9.4% on a constant-currency basis. Prior to intersegment eliminations, domestic and international total revenue represented 37.5% and 62.5% of total revenue, respectively, compared to 40.1% and 59.9% of total revenue, respectively, in the prior-year quarter primarily due to the acquisition of PLG. Digital revenue grew 11.2% or 10.9% in constant currency, and represented 39.5% of total revenue, compared to 37.5% in the prior year.
<!–[endif]–>
For the fiscal year, operating income was $19 million versus $75 million in the prior year. Operating margin was 0.6% versus 2.6% in the prior year. Adjusted operating margin declined 0.7 percentage points to 4.6% from 5.3% in the prior year. OIBDA was $340 million, up 2.1% from $333 million in the prior year and OIBDA margin declined 0.4 percentage points to 11.2% from 11.6% in the prior year. Adjusted OIBDA grew 12.2% to $459 million and adjusted OIBDA margin expanded 1.0 percentage point to 15.2% from 14.2% in the prior year. The improvement in adjusted OIBDA and adjusted OIBDA margin was related to the acquisition of PLG and related cost synergies.
<!–[endif]–>
Net loss was $303 million compared to $194 million in the prior year. Adjusted net loss was $184 million excluding a loss on extinguishment of debt of $141 million related to the April 2014 refinancing of the company’s Senior Notes due 2018 compared with the $85 million loss on the extinguishment of debt realized in the prior fiscal year. Net debt (total debt minus cash) at the end of the fiscal year was $2.873 billion versus $2.712 billion at the end of the prior year but, due to a lower blended interest rate in the fiscal year, the company’s interest expense remained flat at $203 million.
Cash provided by operating activities was $130 million compared to $159 million in the prior year. Free Cash Flow was negative $25 million, compared to negative $649 million in the prior year. The largest factor impacting the year-over-year change in Free Cash Flow was the PLG acquisition, which was completed in the prior year. This was partially offset by higher capital expenditures of $76 million for the fiscal year, up from $34 million in the prior year. The largest drivers of the increase in capital expenditures were the company’s headquarters move, the consolidation of the company’s offices in the UK and other PLG-related costs, as well as increased investments in IT infrastructure and systems.
Fourth-Quarter Results
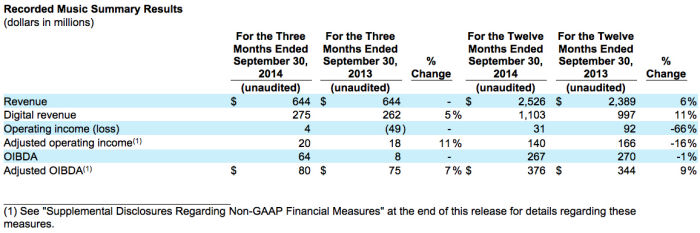
Recorded Music revenue was flat or down 0.8% in constant currency. Digital, licensing and artist services and expanded-rights revenue all grew but were offset by a decline in physical revenue. Licensing revenue growth was driven by activity within the PLG roster and Artist services and expanded-rights revenue was up modestly. Digital revenue grew 5.0%, or 4.2% in constant currency, driven by strength in streaming revenue, and represented 42.7% of total Recorded Music revenue, compared to 40.7% in the prior-year quarter. Domestic Recorded Music digital revenue was $129 million or 52.4% of total domestic Recorded Music revenue. Major sellers in the current-year quarter included Ed Sheeran, Mariya Takeuchi, Blake Shelton, Kyary Pamyu Pamyu and Coldplay.
Operating income was $4 million up from a loss of $49 million in the prior-year quarter and operating margin was 0.6% versus negative 7.6% in the prior-year quarter. Adjusted operating margin rose 0.3 percentage points to 3.1% from 2.8% in the prior-year quarter. OIBDA rose to $64 million versus $8 million in the prior-year quarter, with OIBDA margin up 8.7 percentage points to 9.9% versus 1.2% in the prior-year quarter. Recorded Music adjusted OIBDA rose 6.7% and adjusted OIBDA margin rose 0.8 percentage points to 12.4% from 11.6% in the prior-year quarter due to the timing of the PLG integration and realization of cost savings.
Full-Year Results
Recorded Music revenue grew 5.7% or 5.6% in constant currency. Excluding PLG, Recorded Music revenue declined 5.3%, on an as-reported and constant-currency basis, due in part to ongoing declines in physical and digital download revenue, which were partially offset by an acceleration in the growth of streaming revenue. Artist services and expanded-rights revenue grew, aided by strong concert promotion activity in Europe due to the timing of tours. Recorded Music licensing revenue also was up. Recorded Music digital revenue grew 10.6% or 10.4% in constant currency, and represented 43.7% of total Recorded Music revenue for the fiscal year, up from 41.7% in the prior year. Domestic Recorded Music digital revenue amounted to $540 million, or 57.0% of total domestic Recorded Music revenue versus 54.4% in the prior year. Major sellers included Coldplay, Ed Sheeran, Bruno Mars and Jason Derulo.
Recorded Music operating income was $31 million versus $92 million in the prior year and operating margin was 1.2% versus 3.9% in the prior year. Recorded Music adjusted operating margin declined 1.4 percentage points to 5.5% from 6.9% in the prior year. Recorded Music OIBDA declined 1.1% and OIBDA margin declined 0.7 percentage points to 10.6%. Recorded Music adjusted OIBDA improved 9.3% to $376 million and Recorded Music adjusted OIBDA margin expanded 0.5 percentage points to 14.9% due to PLG related synergies.
Fourth-Quarter Results
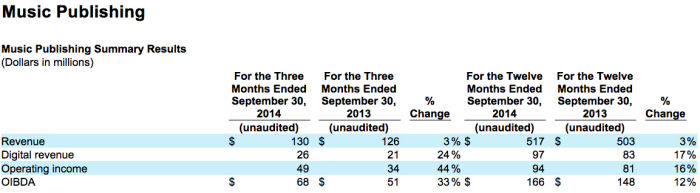
Music Publishing revenue rose 3.2% or 2.4% in constant currency. Digital revenue grew 23.8% due to growth in streaming revenue. Mechanical revenue declined 22.2% due to the continued transition from physical to digital sales. Synchronization revenue rose 4.3% and Performance revenue rose 9.8%.
Music Publishing operating margin rose 10.7 percentage points to 37.7% from 27.0% in the prior-year quarter. Music Publishing OIBDA rose 33.3% to $68 million from $51 million in the prior-year quarter while Music Publishing OIBDA margin rose 11.8 percentage points to 52.3% from 40.5% in the prior-year quarter driven in part by the reversal of a previously accrued earn-out payment in the current-year quarter.
Full-Year Results
Music Publishing revenue rose 2.8% or 2.2% in constant currency. The increase in Music Publishing revenue was driven by a 16.9% increase, on an as-reported and constant-currency basis, in digital revenue, a 4.6% increase, or 4.0% in constant currency, in performance revenue, and a 4.1% increase or 3.0% in constant currency, in synchronization revenue. This growth was partially offset by a 10.6% decline or 11.4% in constant currency, in mechanical revenue. Music Publishing digital revenue represented 18.8% of total Music Publishing revenue in the current fiscal year, up from 16.5% in the prior fiscal year.
Music Publishing operating margin was 18.2%, up 2.1 percentage points from 16.1% in the prior year. Music Publishing OIBDA grew 12.2% to $166 million, while Music Publishing OIBDA margin was 32.1%, up 2.7 percentage points from 29.4% in the prior year, driven in part by the one-time benefit in the current year from the reversal of a previously accrued earn-out payment.
Financial details for the quarter and fiscal year can be found in the company’s Annual Report on Form 10-K, for the period ended September 30, 2014, filed today with the Securities and Exchange Commission.
This morning, management will be hosting a conference call to discuss the results at 8:30 A.M. EST. The call will be webcast on www.wmg.com.
About Warner Music Group
With its broad roster of new stars and legendary artists, Warner Music Group is home to a collection of the best-known record labels in the music industry including Asylum, Atlantic, Big Beat, East West, Elektra, Erato, Fueled by Ramen, Nonesuch, Parlophone, Reprise, Rhino, Roadrunner, Rykodisc, Sire, Warner Bros., Warner Classics, Warner Music Nashville and Word, as well as Warner/Chappell Music, one of the world’s leading music publishers, with a catalog of more than one million copyrights worldwide.
“Safe Harbor” Statement under Private Securities Litigation Reform Act of 1995
This communication includes forward-looking statements that reflect the current views of Warner Music Group about future events and financial performance. Words such as “estimates,” “expects,” “anticipates,” “projects,” “plans,” “intends,” “believes,” “forecasts” and variations of such words or similar expressions that predict or indicate future events or trends, or that do not relate to historical matters, identify forward-looking statements. All forward-looking statements are made as of today, and we disclaim any duty to update such statements. Our expectations, beliefs and projections are expressed in good faith and we believe there is a reasonable basis for them. However, we cannot assure you that management’s expectations, beliefs and projections will result or be achieved. Investors should not rely on forward-looking statements because they are subject to a variety of risks, uncertainties, and other factors that could cause actual results to differ materially from our expectations. Please refer to our Form 10-K, Form 10-Qs and our other filings with the U.S. Securities and Exchange Commission concerning factors that could cause actual results to differ materially from those described in our forward-looking statements.
We maintain an Internet site at www.wmg.com. We use our website as a channel of distribution of material company information. Financial and other material information regarding Warner Music Group is routinely posted on and accessible at https://investors.wmg.com. In addition, you may automatically receive email alerts and other information about Warner Music Group by enrolling your email address through the “email alerts” section at https://investors.wmg.com. Our website and the information posted on it or connected to it shall not be deemed to be incorporated by reference into this communication.
Basis of Presentation
The Company maintains a 52-53 week fiscal year ending on the last Friday in each reporting period. The fiscal year ended September 30, 2014 ended on September 26, 2014 and the fiscal year ended September 30, 2013 ended on September 27, 2013. For convenience purposes, the Company continues to date its financial statements as of September 30.
Supplemental Disclosures Regarding Non-GAAP Financial Measures
We evaluate our operating performance based on several factors, including the following non-GAAP financial measures:
OIBDA
OIBDA reflects our operating income before non-cash depreciation of tangible assets and non-cash amortization of intangible assets. We consider OIBDA to be an important indicator of the operational strengths and performance of our businesses, and believe the presentation of OIBDA helps improve the ability to understand our operating performance and evaluate our performance in comparison to comparable periods. However, a limitation of the use of OIBDA as a performance measure is that it does not reflect the periodic costs of certain capitalized tangible and intangible assets used in generating revenue in our businesses. Accordingly, OIBDA should be considered in addition to, not as a substitute for, operating income, net (loss) income and other measures of financial performance reported in accordance with U.S. GAAP. In addition, OIBDA, as we calculate it, may not be comparable to similarly titled measures employed by other companies.
Adjusted Operating Income, Adjusted OIBDA and Adjusted Net (Loss) Income
Adjusted operating income, Adjusted OIBDA and Adjusted net (loss) income is operating income, OIBDA and net (loss) income, respectively, adjusted to exclude the impact of certain items that affect comparability (“Factors Affecting Comparability”). Factors affecting period-to-period comparability of the unadjusted measures in fiscal year 2014 included the items listed in Figure 6 below. We use Adjusted operating income, Adjusted OIBDA and Adjusted net (loss) income to evaluate our actual operating performance. We believe that the adjusted results provide relevant and useful information for investors because they clarify our actual operating performance, make it easier to compare our results with those of other companies in our industry and allow investors to review performance in the same way as our management. Since these are not measures of performance calculated in accordance with U.S. GAAP, they should not be considered in isolation of, or as a substitute for, operating income, OIBDA and net loss attributable to Warner Music Group Corp. as indicators of operating performance, and they may not be comparable to similarly titled measures employed by other companies.
Constant Currency
Because exchange rates are an important factor in understanding period-to-period comparisons, we believe the presentation of revenue on a constant-currency basis in addition to reported revenue helps improve the ability to understand our operating results and evaluate our performance in comparison to prior periods. Constant-currency information compares results between periods as if exchange rates had remained constant period over period. We use results on a constant-currency basis as one measure to evaluate our performance. We calculate constant-currency results by applying current-year foreign currency exchange rates to prior-year results. However, a limitation of the use of the constant-currency results as a performance measure is that it does not reflect the impact of exchange rates on our revenue. These results should be considered in addition to, not as a substitute for, results reported in accordance with U.S. GAAP. Results on a constant-currency basis, as we present them, may not be comparable to similarly titled measures used by other companies and are not a measure of performance presented in accordance with U.S. GAAP.
Free Cash Flow
Free Cash Flow reflects our cash flow provided by operating activities less capital expenditures and cash paid for investments. We use Free Cash Flow, among other measures, to evaluate our operating performance. Management believes Free Cash Flow provides investors with an important perspective on the cash available to service debt, fund ongoing operations and working capital needs, make strategic acquisitions and investments and pay any dividends or fund any repurchases of our outstanding notes or common stock in open market purchases, privately negotiated purchases or otherwise. As a result, Free Cash Flow is a significant measure of our ability to generate long-term value. It is useful for investors to know whether this ability is being enhanced or degraded as a result of our operating performance. We believe the presentation of Free Cash Flow is relevant and useful for investors because it allows investors to view performance in a manner similar to the method used by management.
Because Free Cash Flow is not a measure of performance calculated in accordance with U.S. GAAP, Free Cash Flow should not be considered in isolation of, or as a substitute for, net (loss) income as an indicator of operating performance or cash flow provided by operating activities as a measure of liquidity. Free Cash Flow, as we calculate it, may not be comparable to similarly titled measures employed by other companies. In addition, Free Cash Flow does not necessarily represent funds available for discretionary use and is not necessarily a measure of our ability to fund our cash needs. Because Free Cash Flow deducts capital expenditures and cash paid for investments from “net cash flow provided by operating activities” (the most directly comparable U.S. GAAP financial measure), users of this information should consider the types of events and transactions that are not reflected. We provide below a reconciliation of Free Cash Flow to the most directly comparable amount reported under U.S. GAAP, which is “net cash flow used in operating activities.”