Financial Highlights
- Strong Quarterly Performance Highlighted by Growth across All Revenue Lines and Margin Expansion in Constant Currency
- Solid Double-Digit Growth in Adjusted OIBDA and Adjusted EBITDA for the Quarter and Full Year
- Continued Momentum in Music Publishing with Double-Digit Revenue Growth
- Robust Operating Cash Flow Growth Which Outperformed Full-Year Expectations
For the three months ended September 30, 2022
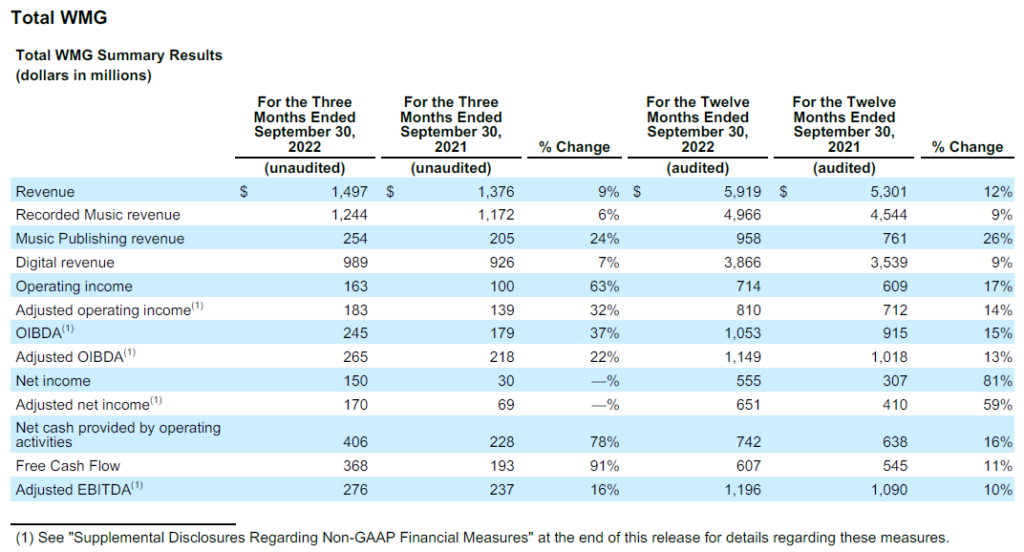
- Total revenue grew 9% or 16% in constant currency
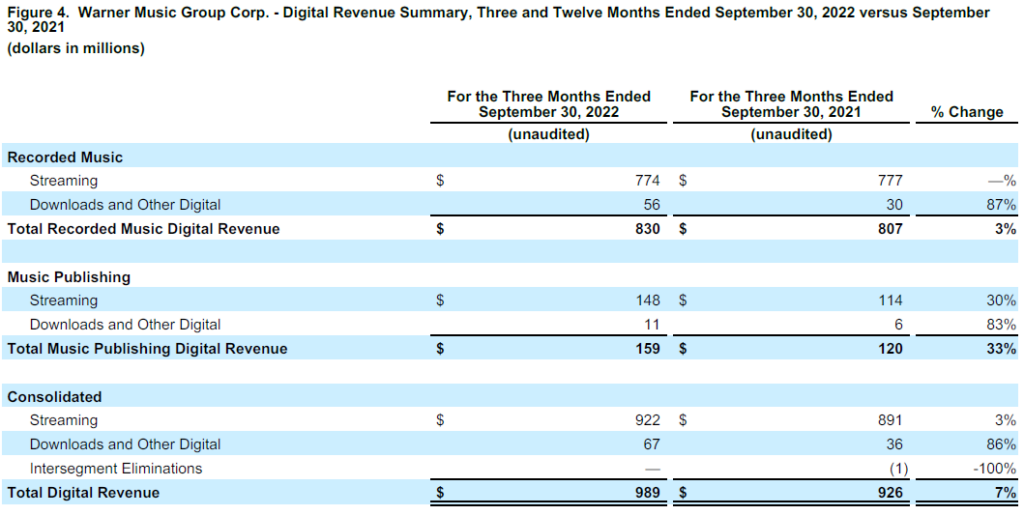
- Digital revenue grew 7% or 12% in constant currency
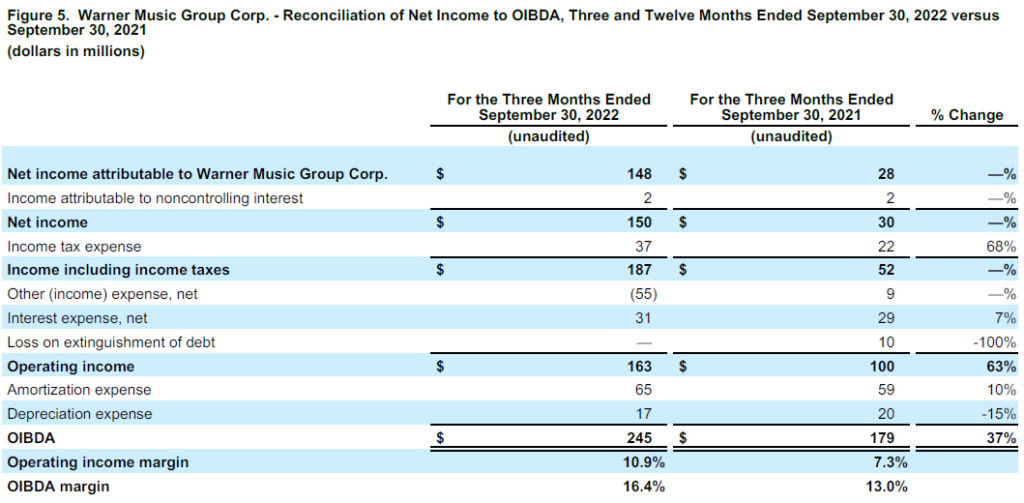
- Net income was $150 million versus $30 million in the prior-year quarter
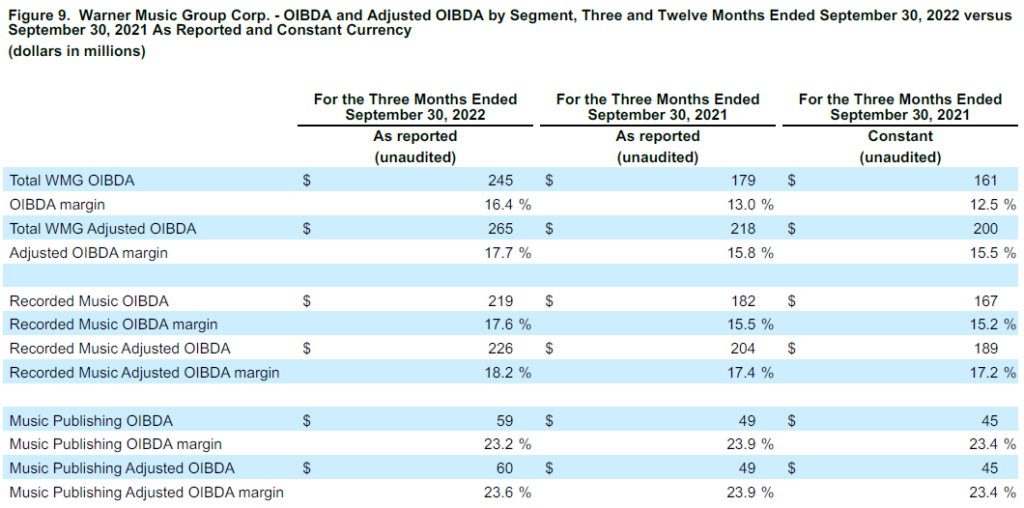
- OIBDA increased 37% to $245 million versus $179 million in the prior-year quarter or 52% in constant currency
- Adjusted OIBDA increased 22% to $265 million versus $218 million in the prior-year quarter or 33% in constant currency
- Adjusted EBITDA increased 16% to $276 million versus $237 million in the prior-year quarter
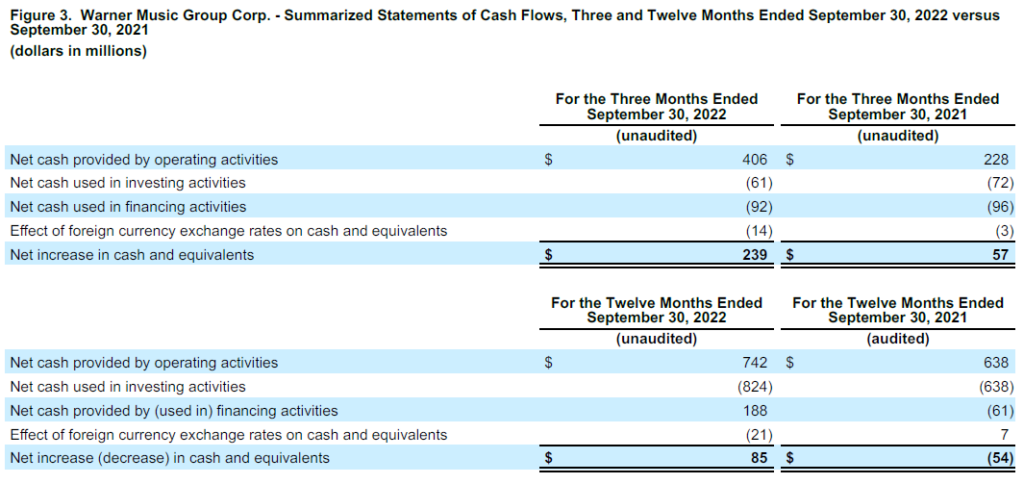
- Cash provided by operating activities increased 78% to $406 million versus $228 million in the prior-year quarter
For the twelve months ended September 30, 2022
- Total revenue grew 12% or 16% in constant currency
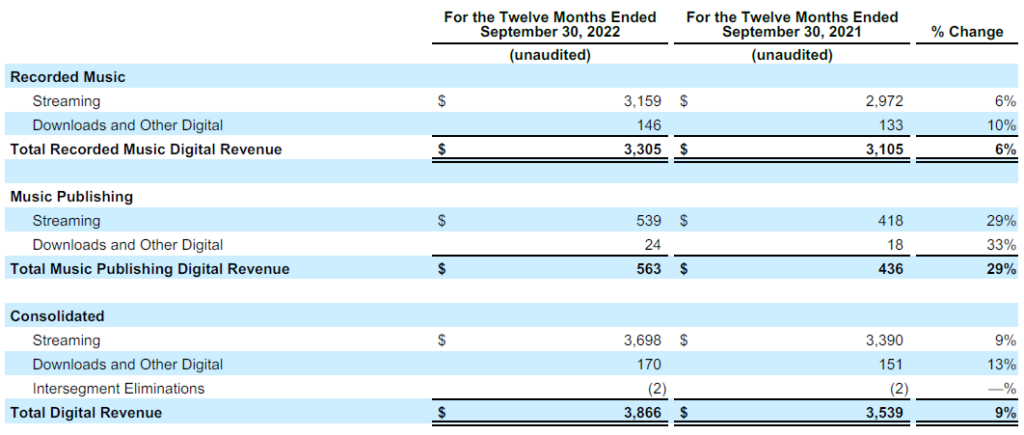
- Digital revenue grew 9% or 13% in constant currency
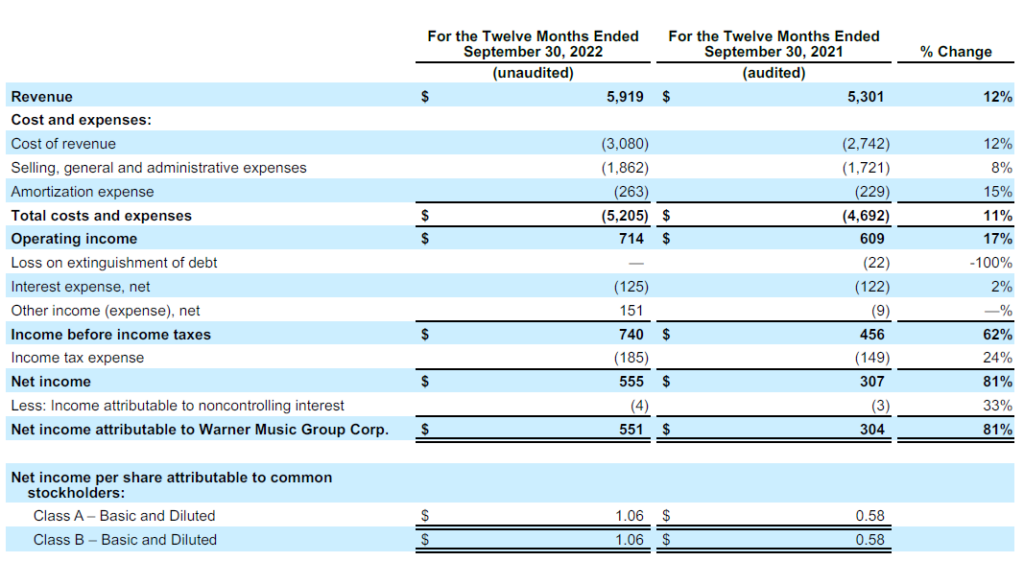
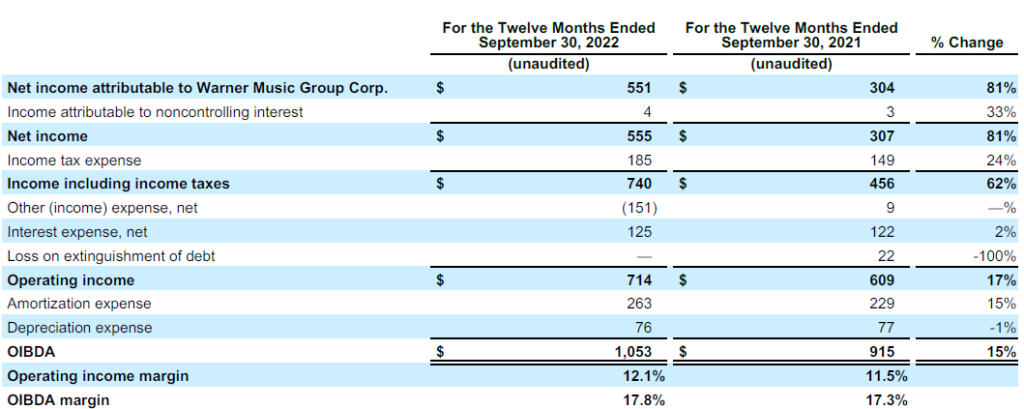
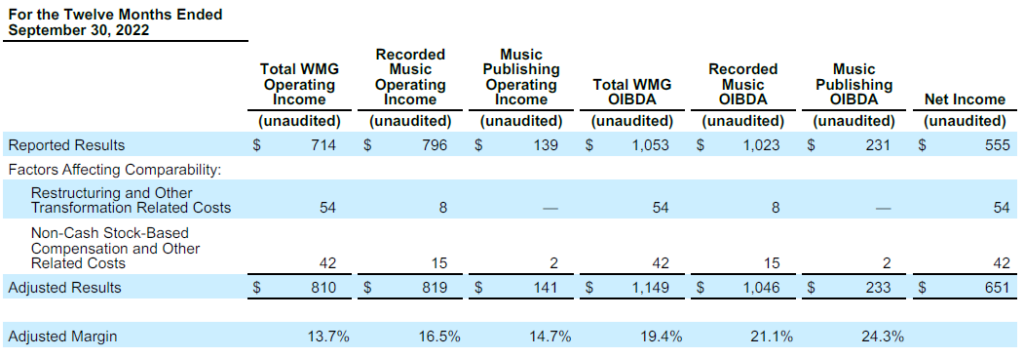
- Net income was $555 million versus $307 million in the prior year
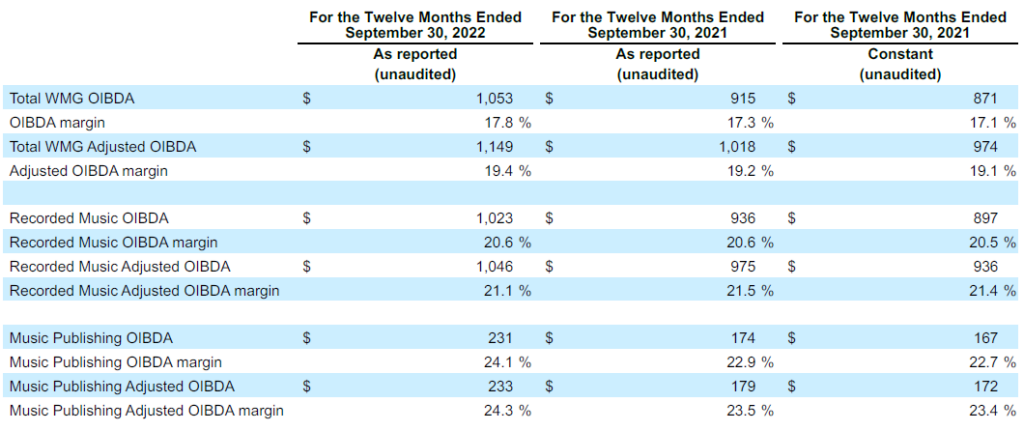
- OIBDA increased 15% to $1,053 million versus $915 million in the prior year or 21% in constant currency
- Adjusted OIBDA increased 13% to $1,149 million versus $1,018 million in the prior year or 18% in constant currency
- Adjusted EBITDA increased 10% to $1,196 million versus $1,090 million in the prior year
- Cash provided by operating activities increased 16% to $742 million versus $638 million in the prior year
NEW YORK, New York, November 22, 2022—Warner Music Group Corp. today announced its fourth-quarter and full-year financial results for the periods ended September 30, 2022.
Steve Cooper, CEO, Warner Music Group, said, “Our strong fourth quarter and full year results were driven by our talented artists, songwriters, and teams, across a wide range of genres, geographies, and generations. Against the backdrop of a challenging macro environment, we once again proved music’s resilience, with new commercial opportunities emerging all the time. We’re very well positioned for long-term creative success, and continued top and bottom line growth. We’re excited to have Robert Kyncl joining next year as WMG’s new CEO, as we enter the next dynamic phase of our evolution.”
Eric Levin, CFO, Warner Music Group, said, “We’ve delivered double-digit revenue growth on a constant currency basis and robust cash flow, driven by excellent operating performance across the company. The momentum in our business is strong, underpinned by global subscriber growth, subscription price increases, and the expansion of emerging platforms. As we look ahead, we’re excited to share amazing releases from the world’s hottest artists, as well as innovative tech collaborations that will strengthen our position at the intersection of music, film, TV, social media, fitness, and gaming.”
Fourth-Quarter Results
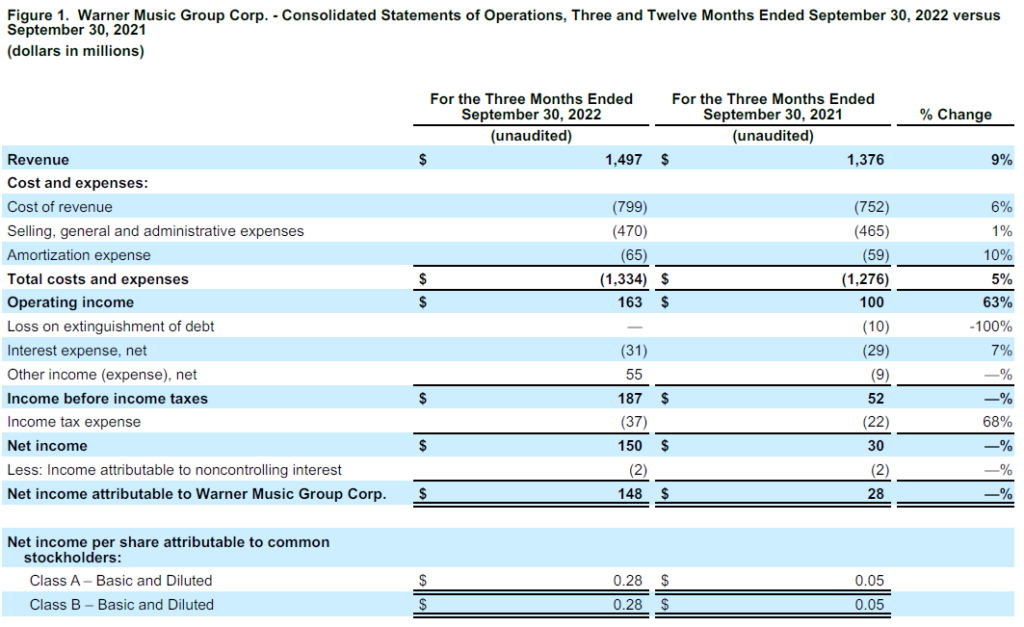
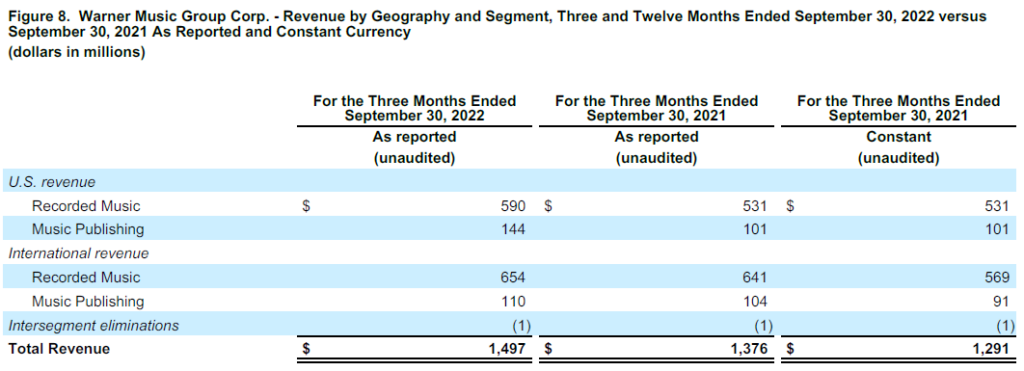
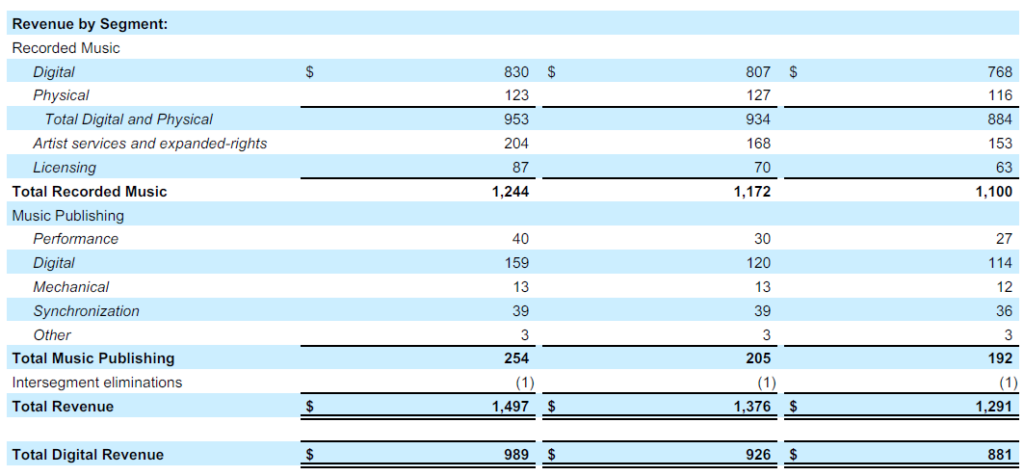
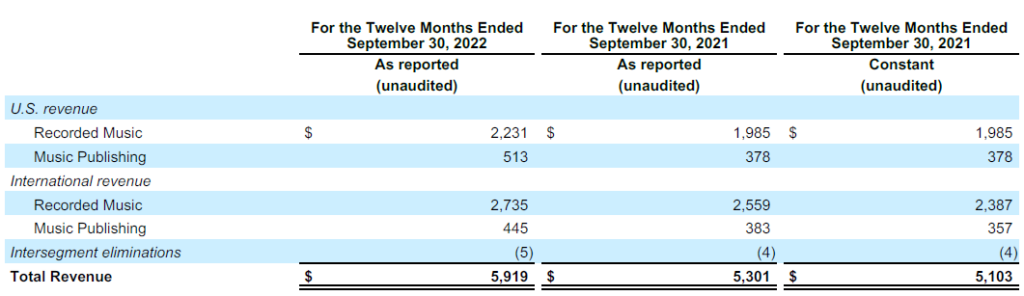
Revenue was up 8.8% (or 16.0% in constant currency). Consistent with the prior quarter, growth in the quarter was unfavorably impacted by foreign currency exchange rates as the U.S. dollar strengthened. The revenue increase in the quarter was driven by digital revenue growth of 6.8% (or 12.3% in constant currency) across Recorded Music and Music Publishing, which includes $38 million in downloads and other digital revenue from the settlement of certain copyright infringement cases (the “Copyright Settlement”). Consistent with the prior three quarters, the quarter included the impact of a new deal with one of the Company’s digital partners affecting Recorded Music streaming revenue. Total streaming revenue increased 3.5% (or 8.9% in constant currency) primarily driven by growth in Music Publishing streaming revenue of 29.8% (or 37.0% in constant currency). Recorded Music streaming revenue decreased by 0.4% (or increased by 4.7% in constant currency) as a result of the continued growth in subscription revenue, offset by a market-related slowdown in ad-supported revenue, the impact of exchange rates and the impact of a new deal with one of the Company’s digital partners. Digital revenue represented 66.1% of total revenue in the quarter, compared to 67.3% in the prior-year quarter. The decrease in digital revenue as a percentage of total revenue is due to the double-digit growth of Recorded Music artist services and expanded-rights and licensing revenue, as well as Music Publishing performance revenue. Music Publishing synchronization and mechanical revenue remained flat on an as-reported basis, but increased in constant currency. Recorded Music physical revenue decreased on an as-reported basis, but increased in constant currency. Excluding the Copyright Settlement and the impact of a new deal with one of the Company’s digital partners, revenue increased 9.0% (or 16.4% in constant currency).
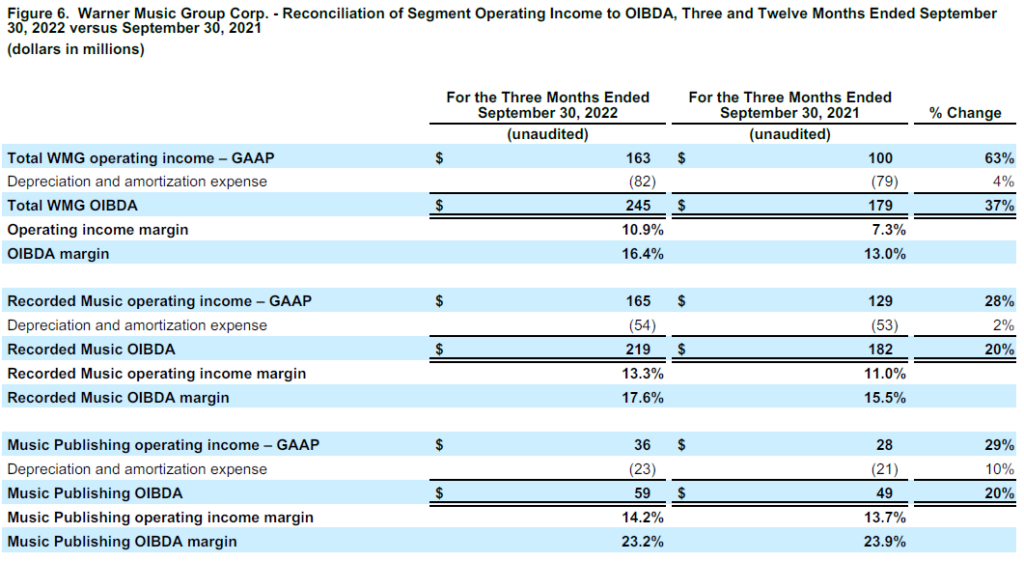
Operating income was $163 million compared to $100 million in the prior-year quarter. OIBDA was $245 million, compared to $179 million in the prior-year quarter, an increase of 36.9% (or 52.2% in constant currency), and OIBDA margin increased 3.4 percentage points to 16.4% from 13.0% in the prior-year quarter (or increased 3.9 percentage points to 16.4% from 12.5% in constant currency). The increases in operating income, OIBDA and OIBDA margin were primarily due to the same factors affecting Adjusted OIBDA discussed below and a decrease in expenses related to restructuring and other transformation initiatives and non-cash stock-based compensation and other related expenses.
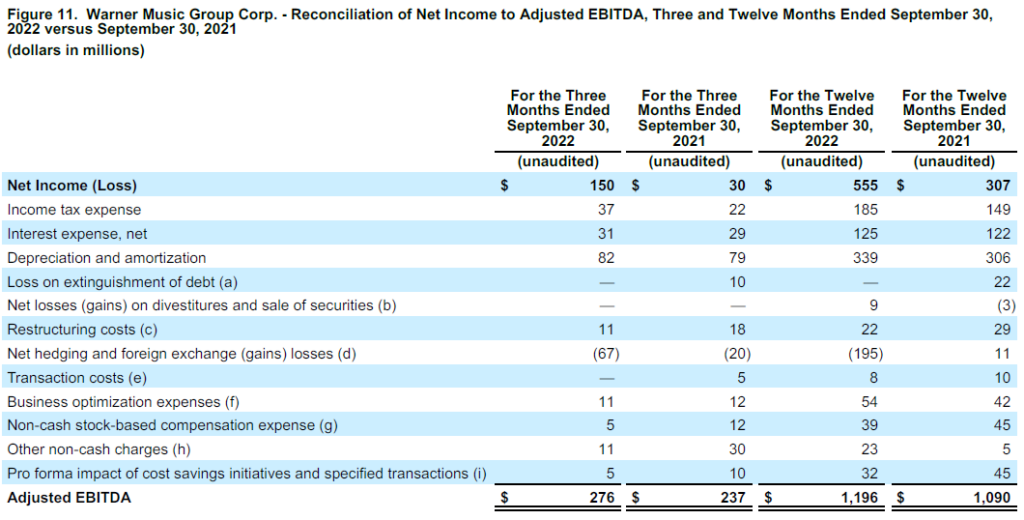
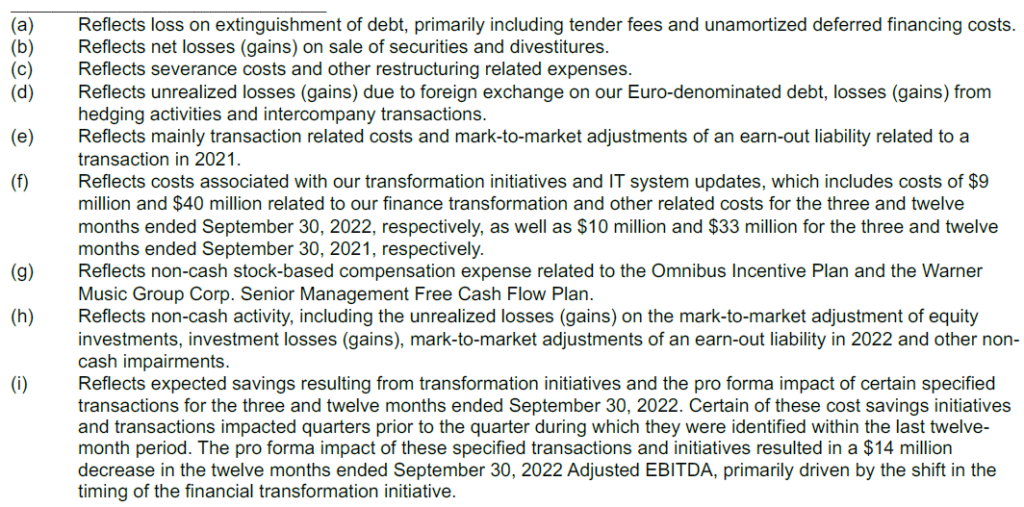
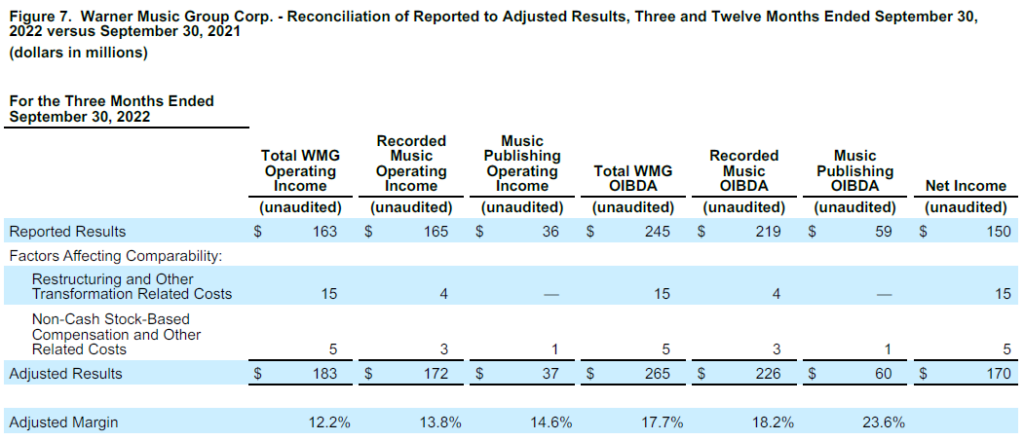
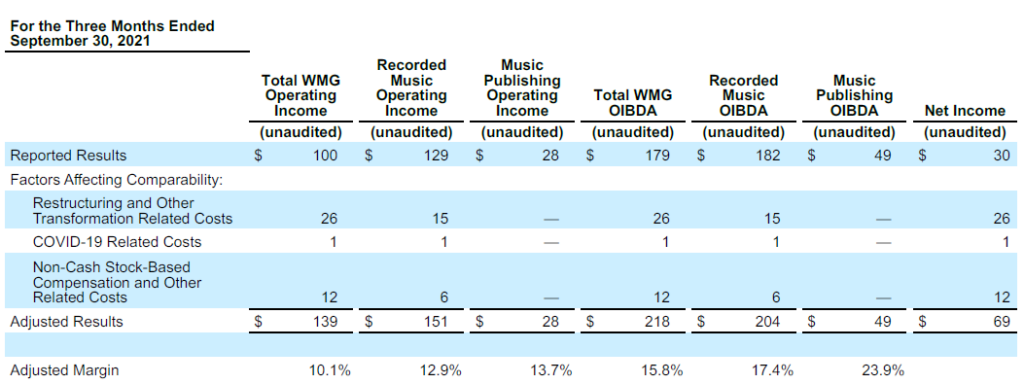
Adjusted operating income, Adjusted OIBDA and Adjusted net income exclude expenses related to restructuring and other transformation initiatives and non-cash stock-based compensation and other related expenses in both the quarter and the prior-year quarter. In the prior-year quarter, COVID-related expenses are also excluded. Adjusted EBITDA excludes these items and includes expected savings resulting from transformation initiatives and the pro forma impact of certain specified transactions. See below for calculations and reconciliations of Adjusted operating income, Adjusted OIBDA, Adjusted net income and Adjusted EBITDA.
Adjusted OIBDA increased 21.6% from $218 million to $265 million (or 32.5% in constant currency) and Adjusted OIBDA margin increased 1.9 percentage points to 17.7% from 15.8% in the prior-year quarter (or increased 2.2 percentage points to 17.7% from 15.5% in constant currency). The increase in Adjusted OIBDA and Adjusted OIBDA margin was primarily due to strong operating performance and $29 million from the Copyright Settlement, partially offset by revenue mix due to the growth of lower-margin artist services and expanded-rights revenue and the impact of exchange rates. Excluding the Copyright Settlement and the impact of a new deal with one of the Company’s digital partners, Adjusted OIBDA increased 20.4% (or 32.6% in constant currency) and Adjusted OIBDA margin increased 1.6 percentage points to 16.2% from 14.6% in the prior-year quarter (or increased 2.0 percentage points to 16.2% from 14.2% in constant currency). Adjusted operating income increased 31.7% from $139 million to $183 million due to the same factors affecting Adjusted OIBDA, partially offset by higher amortization expenses due to recent acquisitions and capital spending.
Adjusted EBITDA increased 16.5% from $237 million to $276 million with Adjusted EBITDA margins increasing 1.2 percentage points from 17.2% to 18.4% largely due to the same factors affecting Adjusted OIBDA, partially offset by reducing the pro forma impact of certain specified transactions, as the impact is realized, and lower pro forma savings from certain cost-savings initiatives, primarily driven by the shift in the timing of the financial transformation initiative.
Net income was $150 million compared to $30 million in the prior-year quarter. Adjusted net income was $170 million compared to $69 million in the prior-year quarter. The increase in net income and Adjusted net income was primarily due to higher operating income, the impact of exchange rates on the Company’s Euro-denominated debt and intercompany loans, lower loss on mark-to-market adjustment of equity investments and a loss on extinguishment of debt in the prior-year quarter, partially offset by an increase in income tax expense due to higher pre-tax income.
Basic and Diluted earnings per share was $0.28 for both the Class A and Class B shareholders due to the net income attributable to the Company in the quarter of $150 million.
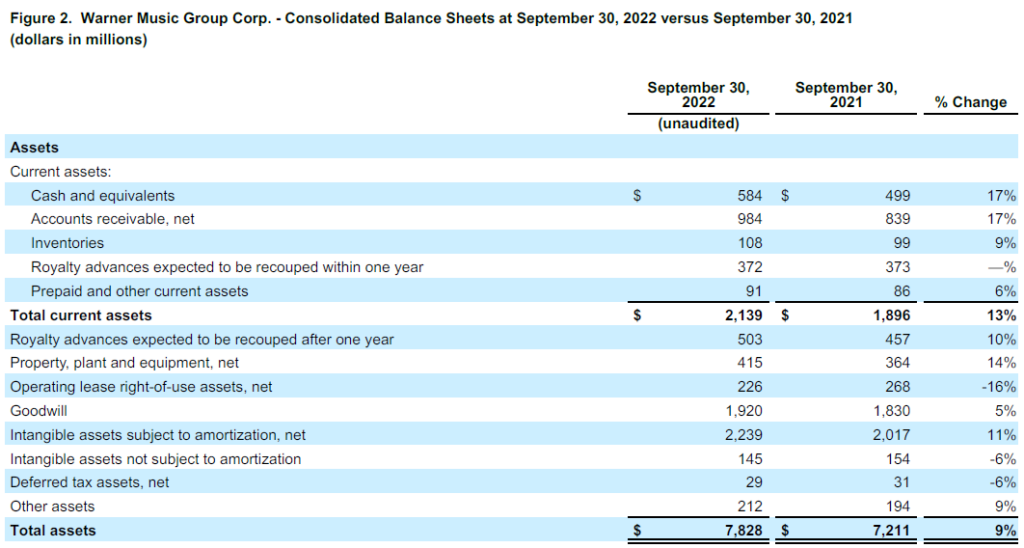
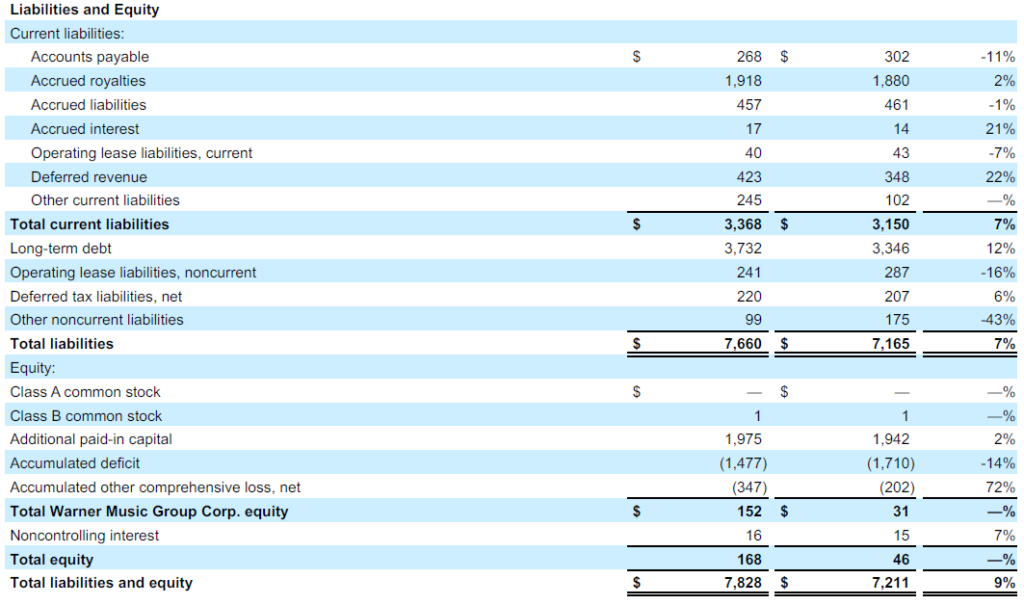
As of September 30, 2022, the Company reported a cash balance of $584 million, total debt of $3.732 billion and net debt (defined as total debt, net of deferred financing costs, premiums and discounts, minus cash and equivalents) of $3.148 billion.
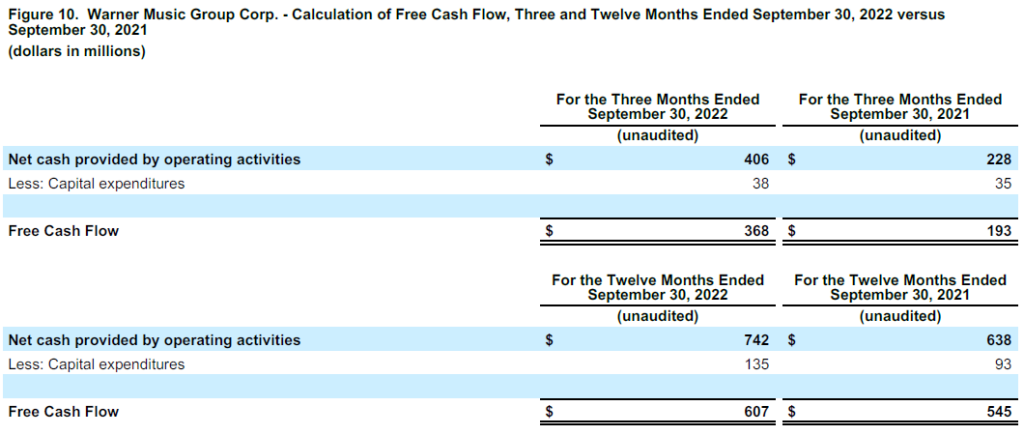
Cash provided by operating activities increased 78% to $406 million from $228 million in the prior-year quarter. The increase was largely a result of strong operating performance, timing of A&R investments, higher recoupments in the quarter and timing of digital deal renewals, partially offset by other movements within working capital. Capital expenditures increased 9% to $38 million from $35 million in the prior-year quarter, mainly due to investments in IT infrastructure, partially offset by lower facilities investments. Free Cash Flow, as defined below, increased 91% to $368 million from $193 million in the prior-year quarter.
Full-Year Results
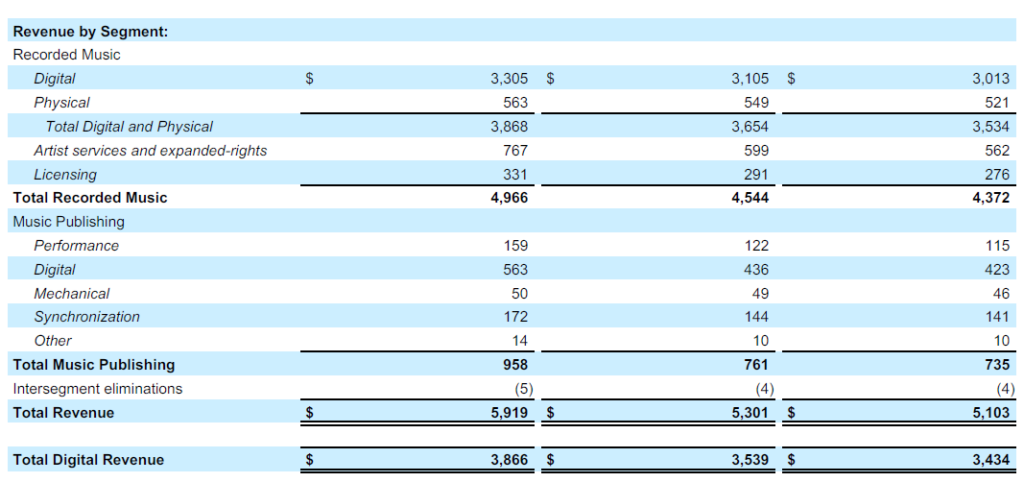
Total revenue increased 11.7% (or 16.0% in constant currency) driven by digital revenue growth of 9.2% (or 12.6% in constant currency) across Recorded Music and Music Publishing, which includes $38 million in downloads and other digital revenue from the Copyright Settlement. The year included an additional week, primarily reflected in Recorded Music streaming revenue. Additionally, the year included the impact of a new deal with one of the Company’s digital partners affecting Recorded Music streaming revenue. Total streaming revenue increased 9.1% (or 12.4% in constant currency) driven by growth across Recorded Music and Music Publishing. Recorded Music streaming revenue increased by 6.3% (or 9.5% in constant currency) due to continued growth in streaming services, which was affected by a market-related slowdown in ad-supported revenue and the benefit of an additional week, partially offset by the impact of a new deal with one of the Company’s digital partners, an $11 million catch-up payment from one of the Company’s digital partners (the “Catch-Up Payment”) and a $10 million true-up payment in ad-supported revenue, all of which benefited the prior year. Music Publishing streaming revenue increased by 28.9% (or 32.8% in constant currency), which includes a benefit of $20 million resulting from the July 1, 2022 remand ruling by the Copyright Royalty Board in Phonorecords III upholding higher percentage of revenue U.S. mechanical royalty rates for 2018 to 2022 and reflects amounts expected to be paid (the “CRB Rate Benefit”). Digital revenue represented 65.3% of total revenue, compared to 66.8% in the prior year. The decrease in digital revenue as a percentage of total revenue is primarily due to the growth of artist services and expanded-rights revenue. Revenue increases in the year were also driven by growth in Recorded Music licensing and physical revenue and Music Publishing performance, synchronization and mechanical revenue. Excluding the Copyright Settlement, the benefit of an additional week, the impact of a new deal with one of the Company’s digital partners, the Catch-Up Payment, the true-up payment in ad-supported revenue and the CRB Rate Benefit, revenue increased 12.4% (or 16.9% in constant currency).
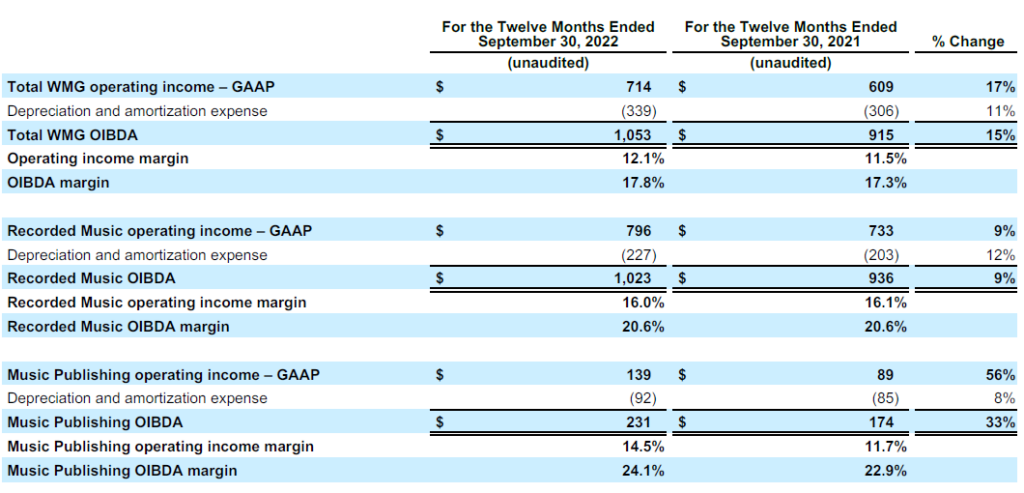
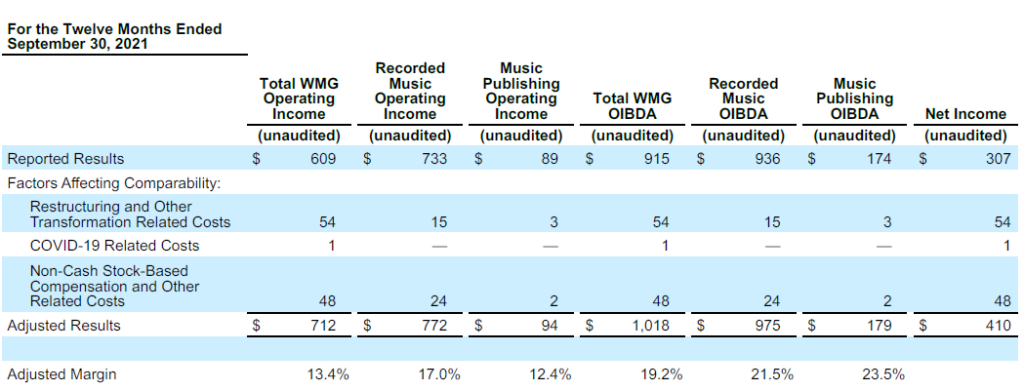
Operating income was $714 million compared to $609 million in the prior year. OIBDA was $1,053 million, compared to $915 million in the prior year, an increase of 15.1% (or 20.9% in constant currency), and OIBDA margin increased 0.5 percentage points to 17.8% from 17.3% in the prior year (or increased 0.7 percentage points to 17.8% from 17.1% in constant currency). The increases in operating income, OIBDA and OIBDA margin were primarily due to strong operating performance, partially offset by the impact of exchange rates.
Adjusted operating income, Adjusted OIBDA and Adjusted net income exclude expenses related to restructuring and other transformation initiatives and non-cash stock-based compensation and other related expenses in both the year and the prior year. In the prior year, COVID-related expenses are also excluded. Adjusted EBITDA excludes these items and includes expected savings resulting from transformation initiatives and the pro forma impact of certain specified transactions. See below for calculations and reconciliations of Adjusted operating income, Adjusted OIBDA, Adjusted net income and Adjusted EBITDA.
Adjusted OIBDA increased 12.9% from $1,018 million to $1,149 million (or 18.0% in constant currency) and Adjusted OIBDA margin increased 0.2 percentage points to 19.4% from 19.2% in the prior year (or increased 0.3 percentage points to 19.4% from 19.1% in constant currency). The increase in Adjusted OIBDA and Adjusted OIBDA margin was primarily due to the same factors affecting OIBDA. Excluding the Copyright Settlement, the benefit of an additional week, the impact of a new deal with one of the Company’s digital partners, the Catch-Up Payment, the true-up payment in ad-supported revenue and the CRB Rate Benefit, Adjusted OIBDA increased 15.8% (or 21.6% in constant currency) and Adjusted OIBDA margin increased 0.6 percentage points to 18.6% from 18.0% in the prior year (or increased 0.7 percentage points to 18.6% from 17.9% in constant currency). Adjusted operating income increased 13.8% from $712 million to $810 million due to the same factors affecting Adjusted OIBDA, partially offset by higher amortization expenses due to recent acquisitions and capital spending.
Adjusted EBITDA increased 9.7% from $1,090 million to $1,196 million with Adjusted EBITDA margins decreasing 0.4 percentage points from 20.6% to 20.2% largely due to the same factors affecting Adjusted OIBDA, offset by lower pro forma impact of certain specified transactions and lower pro forma savings from certain cost-savings initiatives, primarily driven by the shift in timing of the financial transformation initiative, and the impact of the mark-to-market adjustment of an earn-out liability related to an acquisition, which is excluded from Adjusted EBITDA.
Net income was $555 million compared to $307 million in the prior year. Adjusted net income was $651 million compared to $410 million in the prior year. The increase in net income and Adjusted net income was primarily due to higher operating income, the impact of exchange rates on the Company’s Euro-denominated debt and intercompany loans and a loss on extinguishment of debt in the prior year, partially offset by aggregate realized and unrealized losses related to certain investments and an increase in income tax expense due to higher pre-tax income.
Basic and Diluted earnings per share was $1.06 for both the Class A and Class B shareholders due to the net income attributable to the Company in the year of $555 million.
Net debt (defined as total debt, net of deferred financing costs, premiums and discounts, minus cash and equivalents) at the end of the year was $3.148 billion compared to $2.847 billion at the end of the prior year.
Cash provided by operating activities increased 16% to $742 million from $638 million in the prior year. The change was largely a result of strong operating performance. Capital expenditures increased 45% to $135 million from $93 million in the prior year, mainly due to investments in IT infrastructure and facilities, including the EMP fulfillment center expansion. Free Cash Flow, as defined below, increased 11% to $607 million from $545 million in the prior year.
Fourth-Quarter Results
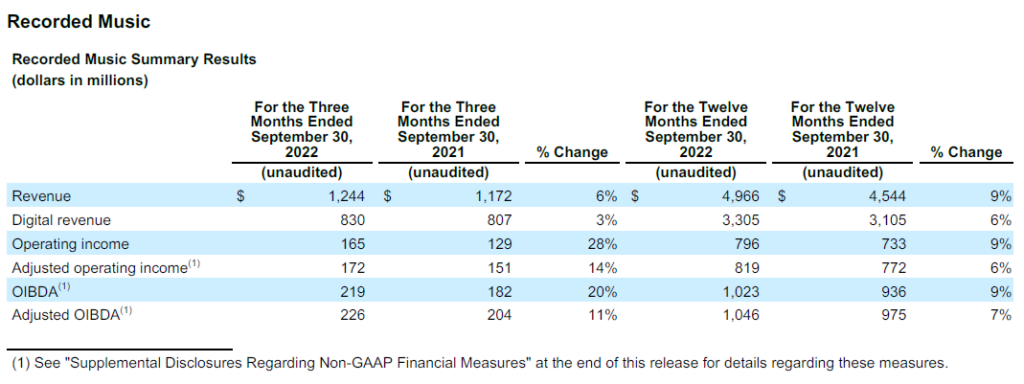
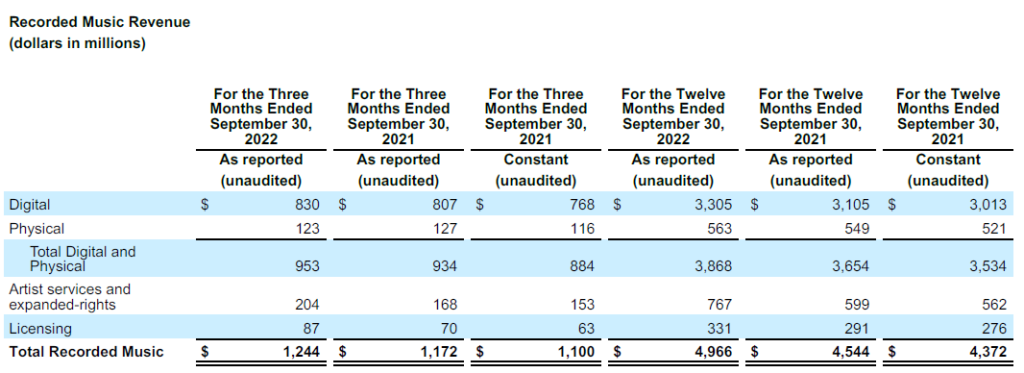
Recorded Music revenue was up 6.1% (or 13.1% in constant currency) due to artist services and expanded-rights revenue growth of 21.4% (or 33.3% in constant currency), reflecting an increase in merchandising and concert promotion revenue. Digital revenue was up 2.9% (or 8.1% in constant currency), which includes $31 million in downloads and other digital revenue from the Copyright Settlement. Streaming revenue was down 0.4% (or up 4.7% in constant currency). Adjusted for the impact of a new deal with one of the Company’s digital partners, Recorded Music streaming revenue was up 4.7% (or 10.4% in constant currency). Streaming revenue reflects continued growth in subscription revenue, which was affected by a market-related slowdown in ad-supported revenue. Digital revenue represented 66.7% of total Recorded Music revenue versus 68.9% in the prior-year quarter. The decrease in digital revenue as a percentage of total Recorded Music revenue is due to the growth of artist services and expanded-rights and licensing revenue. Licensing revenue increased 24.3% (or 38.1% in constant currency), mainly due to higher broadcast fees, synchronization and other activity, partially offset by the impact of exchange rates. Physical revenue was down 3.1% (or up 6.0% in constant currency) primarily due to the impact of exchange rates, which offset higher vinyl sales and strong performance in Japan. Excluding the Copyright Settlement and the impact of a new deal with one of the Company’s digital partners, revenue increased 7.0% (or 14.2% in constant currency). Major sellers included Ed Sheeran, Jack Harlow, Dua Lipa and Lizzo.
Recorded Music operating income was $165 million, up from $129 million in the prior-year quarter and operating margin was up 2.3 percentage points to 13.3% versus 11.0% in the prior-year quarter. OIBDA increased 20.3% to $219 million from $182 million (or 31.1% in constant currency) in the prior-year quarter and OIBDA margin increased 2.1 percentage points to 17.6% from 15.5% in the prior-year quarter (or increased 2.4 percentage points to 17.6% from 15.2% in constant currency). Adjusted OIBDA increased 10.8% from $204 million to $226 million (or 19.6% in constant currency) with Adjusted OIBDA margin up 0.8 percentage points to 18.2% from 17.4% in the prior-year quarter (or up 1.0 percentage points to 18.2% from 17.2% in constant currency). The increases in operating income, OIBDA, operating margin and OIBDA margin were primarily due to the same factors affecting Adjusted OIBDA discussed below and a decrease in expenses related to restructuring and other transformation initiatives and non-cash stock-based compensation and other related expenses. The increase in Adjusted OIBDA and Adjusted OIBDA margin was primarily due to strong operating performance and $15 million from the Copyright Settlement, partially offset by revenue mix resulting from the growth of lower-margin artist services and expanded-rights revenue and the impact of exchange rates. Excluding the Copyright Settlement and the impact of a new deal with one of the Company’s digital partners, Adjusted OIBDA increased 15.9% (or 26.3% in constant currency) and Adjusted OIBDA margin increased 1.4 percentage points to 17.4% from 16.0% in the prior-year quarter (or increased 1.7 percentage points to 17.4% from 15.7% in constant currency).
Full-Year Results
Recorded Music revenue was up 9.3% (or 13.6% in constant currency) due to growth across all revenue lines, including increases in digital revenue, which reflect the continued growth in streaming, the Company’s largest source of revenue. Digital revenue was up 6.4% (or 9.7% in constant currency), which includes $31 million in downloads and other digital revenue from the Copyright Settlement. Streaming revenue was up 6.3% (or 9.5% in constant currency). Adjusted for the benefit of an additional week, the impact of a new deal with one of the Company’s digital partners, the Catch-Up Payment and the true-up payment in ad-supported revenue, Recorded Music streaming revenue was up 9.9% (or 13.5% in constant currency). Streaming revenue reflects continued growth, which was affected by a market-related slowdown in ad-supported revenue and the strength of new and carryover releases. Digital revenue represented 66.6% of total Recorded Music revenue versus 68.3% in the prior year. The decrease in digital revenue as a percentage of total Recorded Music revenue is due to the continued growth of artist services and expanded-rights revenue. Artist services and expanded-rights revenue was up 28.0% (or 36.5% in constant currency), reflecting an increase in concert promotion, which was disrupted by COVID in the prior year, and merchandising revenue. Licensing revenue increased 13.7% (or 19.9% in constant currency), mainly due to higher synchronization and other activity. Physical revenue was up 2.6% (or 8.1% in constant currency) primarily from higher sales due to the success of new releases and an increased demand for vinyl products. Excluding the Copyright Settlement, the benefit of an additional week, the impact of a new deal with one of the Company’s digital partners, the Catch-Up Payment and the true-up payment in ad-supported revenue, revenue increased 10.7% (or 15.2% in constant currency). Major sellers included Ed Sheeran, Dua Lipa, Silk Sonic and Coldplay.
Recorded Music operating income was $796 million, up from $733 million in the prior year and operating margin was down 0.1 percentage point to 16.0% versus 16.1% in the prior year. OIBDA increased 9.3% to $1,023 million from $936 million (or 14.0% in constant currency) in the prior year and OIBDA margin remained flat at 20.6% (or increased 0.1 percentage point to 20.6% from 20.5% in constant currency). Adjusted OIBDA increased 7.3% from $975 million to $1,046 million (or 11.8% in constant currency) with Adjusted OIBDA margin down 0.4 percentage points to 21.1% from 21.5% in the prior year (or down 0.3 percentage points to 21.1% from 21.4% in constant currency). The increases in operating income, OIBDA and Adjusted OIBDA were primarily driven by increased revenue. The decreases in operating margin and Adjusted OIBDA margin were primarily due to strong operating performance, which was offset by revenue mix resulting from the growth of lower-margin artist services and expanded-rights revenue and the impact of exchange rates. Excluding the Copyright Settlement, the benefit of an additional week, the impact of a new deal with one of the Company’s digital partners, the Catch-Up Payment and the true-up payment in ad-supported revenue, Adjusted OIBDA increased 12.0% (or 17.1% in constant currency) and Adjusted OIBDA margin increased 0.2 percentage points to 20.4% from 20.2% in the prior year (or increased 0.3 percentage points to 20.4% from 20.1% in constant currency).
Fourth-Quarter Results
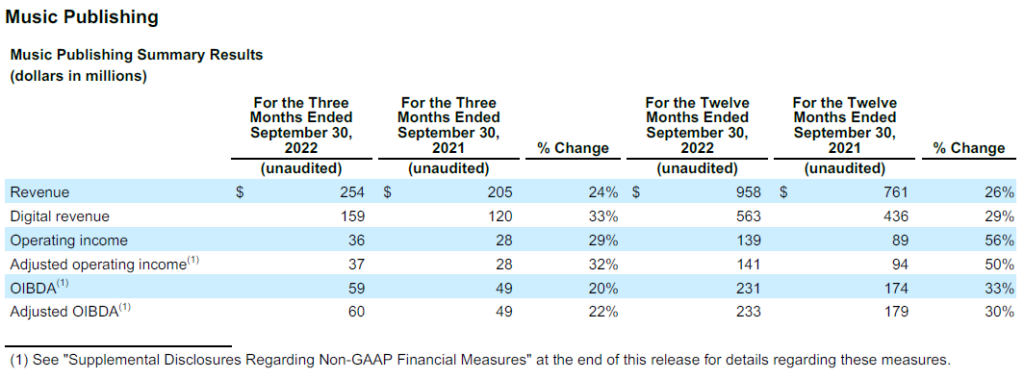
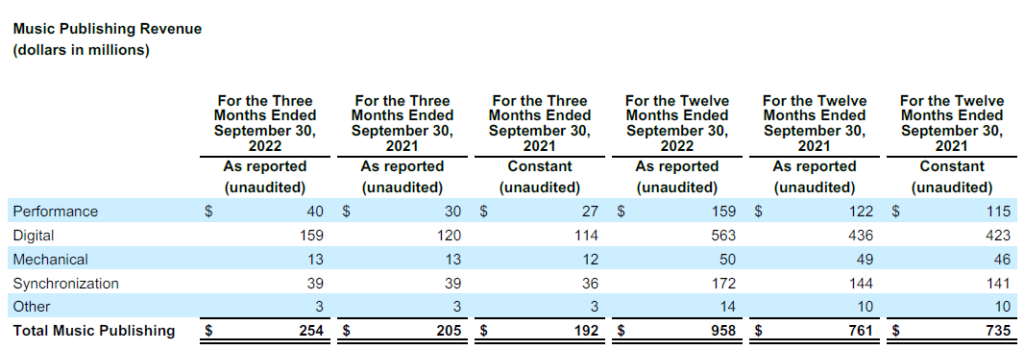
Music Publishing revenue increased 23.9% (or 32.3% in constant currency). The revenue increase was driven by growth in digital and performance revenue. Digital revenue increased 32.5% (or 39.5% in constant currency), which includes $7 million in downloads and other digital revenue from the Copyright Settlement. Streaming revenue increased 29.8% (or 37.0% in constant currency), reflecting the continued growth in streaming services and timing of new digital deals. Digital revenue represented 62.6% of total Music Publishing revenue versus 58.5% in the prior-year quarter. Performance revenue increased due to continued growth from bars, restaurants, concerts and live events. Synchronization and mechanical revenue remained constant on an as-reported basis, but increased in constant currency. Excluding the Copyright Settlement, revenue increased 20.5% (or 28.6% in constant currency).
Music Publishing operating income was $36 million compared to $28 million in the prior-year quarter and operating margin increased 0.5 percentage points to 14.2%. Music Publishing OIBDA increased 20.4% to $59 million (or 31.1% in constant currency) and OIBDA margin decreased 0.7 percentage points to 23.2% from 23.9% in the prior-year quarter (or decreased 0.2 percentage points to 23.2% from 23.4% in constant currency). Adjusted OIBDA increased 22.4% to $60 million (or 33.3% in constant currency) and Adjusted OIBDA margin decreased 0.3 percentage points to 23.6% from 23.9% in the prior-year quarter (or increased 0.2 percentage points to 23.6% from 23.4% in constant currency). The increase in operating income, OIBDA and Adjusted OIBDA were primarily driven by increased revenue. The decrease in OIBDA margin and Adjusted OIBDA margin were primarily due to strong operating performance, which was offset by the impact of exchange rates. Excluding the Copyright Settlement, Adjusted OIBDA increased 20.4% (or 31.1% in constant currency) and Adjusted OIBDA margin remained flat at 23.9% (or increased 0.5 percentage points to 23.9% from 23.4% in constant currency).
Full-Year Results
Music Publishing revenue increased 25.9% (or 30.3% in constant currency). The revenue increase was driven by growth in digital, performance, synchronization and mechanical revenue. Digital revenue increased 29.1% (or 33.1% in constant currency), which includes $7 million in downloads and other digital revenue from the Copyright Settlement. Streaming revenue increased 28.9% (or 32.8% in constant currency), reflecting the continued growth in streaming services, the CRB Rate Benefit and timing of new digital deals. Adjusted for the CRB Rate Benefit of $20 million, streaming revenue increased 24.2% (or 27.8% in constant currency). Digital revenue represented 58.8% of total Music Publishing revenue versus 57.3% in the prior year. Performance revenue increased as bars, restaurants, concerts and live events continued to recover from COVID disruption. Synchronization revenue increased due to higher television and commercial licensing activity. The increase in mechanical revenue was partially offset by the impact of exchange rates. Excluding the Copyright Settlement and the CRB Rate Benefit, revenue increased 22.3% (or 26.7% in constant currency).
Music Publishing operating income was $139 million compared to $89 million in the prior year and operating margin increased 2.8 percentage points to 14.5%. Music Publishing OIBDA increased 32.8% to $231 million (or 38.3% in constant currency) and OIBDA margin increased 1.2 percentage points to 24.1% from 22.9% in the prior year (or increased 1.4 percentage points to 24.1% from 22.7% in constant currency). Adjusted OIBDA increased 30.2% to $233 million (or 35.5% in constant currency) and Adjusted OIBDA margin increased 0.8 percentage points to 24.3% from 23.5% in the prior year (or increased 0.9 percentage points to 24.3% from 23.4% in constant currency). The increase in operating income, OIBDA and Adjusted OIBDA were primarily due to strong operating performance, partially offset by the impact of exchange rates. Excluding the Copyright Settlement and the CRB Rate Benefit, Adjusted OIBDA increased 26.8% (or 32.0% in constant currency) and Adjusted OIBDA margin increased 0.9% percentage points to 24.4% from 23.5% in the prior year (or increased 1.0 percentage points to 24.4% from 23.4% in constant currency).
This morning, management will be hosting a conference call to discuss the results at 8:30 A.M. ET. The call will be webcast on www.wmg.com.
With a legacy extending back over 200 years, Warner Music Group today is home to an unparalleled family of creative artists, songwriters, and companies that are moving culture across the globe. At the core of WMG’s Recorded Music division are four of the most iconic companies in history: Atlantic, Elektra, Parlophone and Warner Records. They are joined by renowned labels such as 300 Entertainment, Asylum, Big Beat, Canvasback, East West, Erato, FFRR, Fueled by Ramen, Nonesuch, Reprise, Rhino, Roadrunner, Sire, Spinnin’ Records, Warner Classics and Warner Music Nashville. Warner Chappell Music – which traces its origins back to the founding of Chappell & Company in 1811 – is one of the world’s leading music publishers, with a catalog of more than one million copyrights spanning every musical genre from the standards of the Great American Songbook to the biggest hits of the 21st century.
“Safe Harbor” Statement under Private Securities Litigation Reform Act of 1995
This communication includes forward-looking statements that reflect the current views of Warner Music Group about future events and financial performance. Words such as “estimates,” “expects,” “anticipates,” “projects,” “plans,” “intends,” “believes,” “forecasts” and variations of such words or similar expressions that predict or indicate future events or trends, or that do not relate to historical matters, identify forward-looking statements. All forward-looking statements are made as of today, and we disclaim any duty to update such statements. Our expectations, beliefs and projections are expressed in good faith and we believe there is a reasonable basis for them. However, we cannot assure you that management’s expectations, beliefs and projections will result or be achieved. Investors should not rely on forward-looking statements because they are subject to a variety of risks, uncertainties, and other factors that could cause actual results to differ materially from our expectations. Please refer to our Form 10-K, Form 10-Qs and our other filings with the U.S. Securities and Exchange Commission concerning factors that could cause actual results to differ materially from those described in our forward-looking statements.
We maintain an Internet site at www.wmg.com. We use our website as a channel of distribution for material company information. Financial and other material information regarding Warner Music Group is routinely posted on and accessible at http://investors.wmg.com. In addition, you may automatically receive email alerts and other information about Warner Music Group by enrolling your email address through the “email alerts” section at http://investors.wmg.com. Our website and the information posted on it or connected to it shall not be deemed to be incorporated by reference into this communication.
Basis of Presentation
For the periods presented in this release, the Company maintained a 52-53 week fiscal year ending on the last Friday in each reporting period. The fiscal year ended September 30, 2022 includes 53 weeks, and the fiscal year ended September 30, 2021 included 52 weeks. The additional week in fiscal year 2022 fell in the fiscal quarter ended December 31, 2021. All references to September 30, 2022 and September 30, 2021 relate to the periods ended September 30, 2022 and September 24, 2021, respectively. For convenience purposes, the Company dates its financial statements as of September 30 for these periods.
Supplemental Disclosures Regarding Non-GAAP Financial Measures
We evaluate our operating performance based on several factors, including the following non-GAAP financial measures:
OIBDA
OIBDA reflects our operating income before non-cash depreciation of tangible assets and non-cash amortization of intangible assets. We consider OIBDA to be an important indicator of the operational strengths and performance of our businesses, and believe the presentation of OIBDA helps improve the ability to understand our operating performance and evaluate our performance in comparison to comparable periods. However, a limitation of the use of OIBDA as a performance measure is that it does not reflect the periodic costs of certain capitalized tangible and intangible assets used in generating revenue in our businesses. Accordingly, OIBDA should be considered in addition to, not as a substitute for, operating income (loss), net income (loss) and other measures of financial performance reported in accordance with U.S. GAAP. In addition, OIBDA, as we calculate it, may not be comparable to similarly titled measures employed by other companies.
Adjusted Operating Income (Loss), Adjusted OIBDA and Adjusted Net Income (Loss)
Adjusted operating income (loss), Adjusted OIBDA and Adjusted net income (loss) is operating income (loss), OIBDA and net income (loss), respectively, adjusted to exclude the impact of certain items that affect comparability. Factors affecting period-to-period comparability of the unadjusted measures in the quarter included the items listed in Figure 7 below. We use Adjusted operating income (loss), Adjusted OIBDA and Adjusted net income (loss) to evaluate our actual operating performance. We believe that the adjusted results provide relevant and useful information for investors because they clarify our actual operating performance, make it easier to compare our results with those of other companies in our industry and allow investors to review performance in the same way as our management. Since these are not measures of performance calculated in accordance with U.S. GAAP, they should not be considered in isolation of, or as a substitute for, operating income (loss), OIBDA and net income (loss) as indicators of operating performance, and they may not be comparable to similarly titled measures employed by other companies.
Constant Currency
Because exchange rates are an important factor in understanding period-to-period comparisons, we believe the presentation of revenue and OIBDA on a constant-currency basis in addition to reported revenue and OIBDA helps improve the ability to understand our operating results and evaluate our performance in comparison to prior periods. Constant-currency information compares results between periods as if exchange rates had remained constant period over period. We use results on a constant-currency basis as one measure to evaluate our performance. We calculate constant-currency results by applying current-year foreign currency exchange rates to prior-year results. However, a limitation of the use of the constant-currency results as a performance measure is that it does not reflect the impact of exchange rates on our revenue and OIBDA. These results should be considered in addition to, not as a substitute for, results reported in accordance with U.S. GAAP. Results on a constant-currency basis, as we present them, may not be comparable to similarly titled measures used by other companies and are not a measure of performance presented in accordance with U.S. GAAP.
Free Cash Flow
Our definition of Free Cash Flow is defined as cash flow provided by operating activities less capital expenditures. We use Free Cash Flow, among other measures, to evaluate our operating performance. Management believes Free Cash Flow provides investors with an important perspective on the cash available to fund our debt service requirements, ongoing working capital requirements, capital expenditure requirements, strategic acquisitions and investments, and any dividends, prepayments of debt or repurchases or retirement of our outstanding debt or notes in open market purchases, privately negotiated purchases, any repurchases of our common stock or otherwise. As a result, Free Cash Flow is a significant measure of our ability to generate long-term value. It is useful for investors to know whether this ability is being enhanced or degraded as a result of our operating performance. We believe the presentation of Free Cash Flow is relevant and useful for investors because it allows investors to view performance in a manner similar to the method management uses.
Free Cash Flow is not a measure of performance calculated in accordance with U.S. GAAP and therefore it should not be considered in isolation of, or as a substitute for, net income (loss) as an indicator of operating performance or cash flow provided by operating activities as a measure of liquidity. Free Cash Flow, as we calculate it, may not be comparable to similarly titled measures employed by other companies. In addition, Free Cash Flow does not necessarily represent funds available for discretionary use and is not necessarily a measure of our ability to fund our cash needs. Because Free Cash Flow deducts capital expenditures from “net cash provided by operating activities” (the most directly comparable U.S. GAAP financial measure), users of this information should consider the types of events and transactions that are not reflected. We provide below a reconciliation of Free Cash Flow to the most directly comparable amount reported under U.S. GAAP, which is “net cash provided by operating activities.”
Adjusted EBITDA
Adjusted EBITDA is equivalent to “EBITDA” as defined in our Revolving Credit Facility and our 2020 indenture and substantially similar to “EBITDA” as defined under our Senior Term Loan Facility, respectively. Adjusted EBITDA differs from the term “EBITDA” as it is commonly used. The definition of Adjusted EBITDA, in addition to adjusting net income to exclude interest expense, income taxes, and depreciation and amortization, also adjusts net income by excluding items or expenses such as, among other items, (1) the amount of any restructuring charges or reserves; (2) any non-cash charges (including any impairment charges); (3) any net loss resulting from hedging currency exchange risks; (4) the amount of management, monitoring, consulting and advisory fees paid to Access under the Management Agreement or otherwise; (5) business optimization expenses (including consolidation initiatives, severance costs and other costs relating to initiatives aimed at profitability improvement); (6) transaction expenses; (7) equity-based compensation expense; and (8) certain extraordinary, unusual or non-recurring items. The definition of EBITDA under the Revolving Credit Facility also includes adjustments for the pro forma impact of certain projected cost savings, operating expense reductions and synergies and any quality of earnings analysis prepared by independent certified public accountants in connection with an acquisition, merger, consolidation or other investment.
Adjusted EBITDA is a key measure used by our management to understand and evaluate our operating performance, generate future operating plans and make strategic decisions regarding the allocation of capital. Adjusted EBITDA has limitations as an analytical tool, and you should not consider it in isolation or as a substitute for analysis of our results as reported under U.S. GAAP. Some of those limitations include: (1) it does not reflect the periodic costs of certain capitalized tangible and intangible assets used in generating revenue for our business; (2) it does not reflect the significant interest expense or cash requirements necessary to service interest or principal payments on our indebtedness; and (3) it does not reflect every cash expenditure, future requirements for capital expenditures or contractual commitments. In particular, this measure adds back certain non-cash, extraordinary, unusual or non-recurring charges that are deducted in calculating net income; however, these are expenses that may recur, vary greatly and are difficult to predict. In addition, Adjusted EBITDA is not the same as net income or cash flow provided by operating activities as those terms are defined by U.S. GAAP and does not necessarily indicate whether cash flows will be sufficient to fund cash needs. Accordingly, Adjusted EBITDA should be considered in addition to, not as a substitute for, net income (loss) and other measures of financial performance reported in accordance with U.S. GAAP.