Financial Highlights
- Quarterly Revenue Reaches an All-Time High, Underpinned by Double-Digit Growth Across Recorded Music and Music Publishing
- Market Share Gains Drive Sequential Acceleration in Recorded Music Streaming Growth, Led by High-Single Digit Growth in Subscription Streaming
- Music Publishing Performance Reflects Broad-Based Strength Highlighting Strong Second Half Improvement
- 2026 Outlook Supported by Healthy Music Industry Trends and Strategy to Accelerate Growth, with Cost Savings Expected to Contribute 150 to 200 Basis Points of Margin Improvement
For the three months ended September 30, 2025
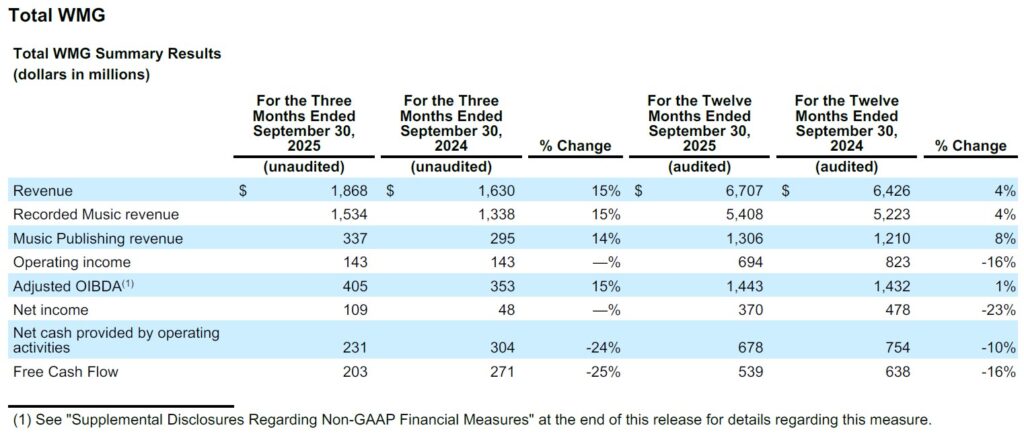
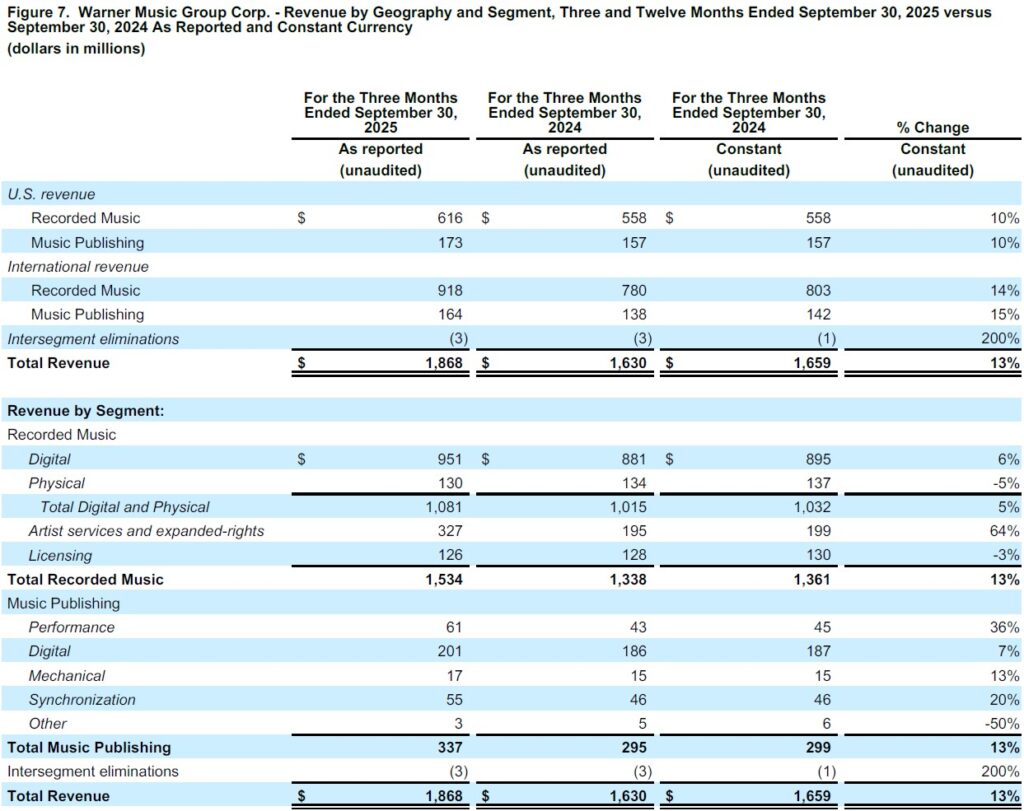
- Total revenue increased 15%, or 13% in constant currency
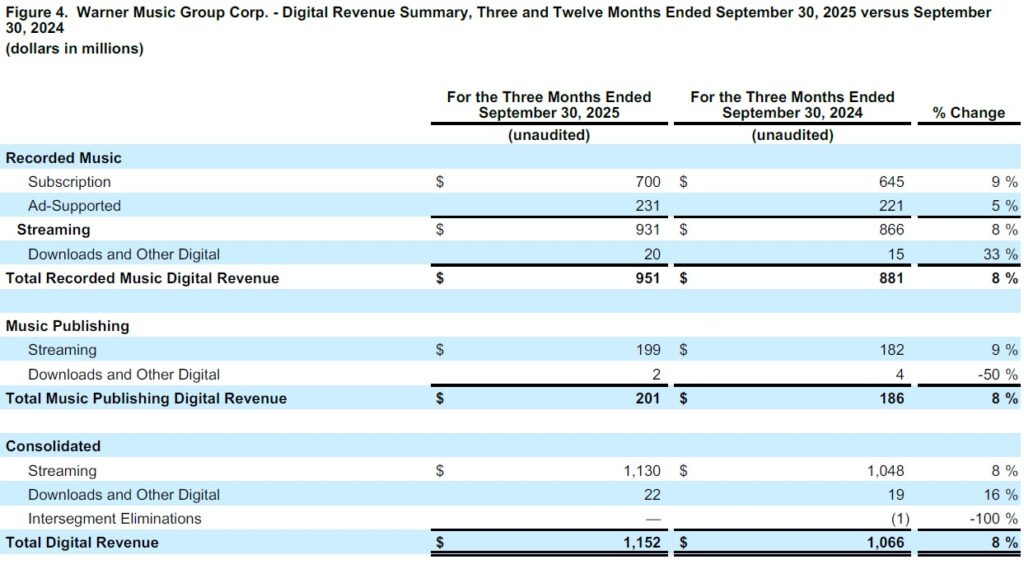
- Digital revenue increased 8%, or 6% in constant currency
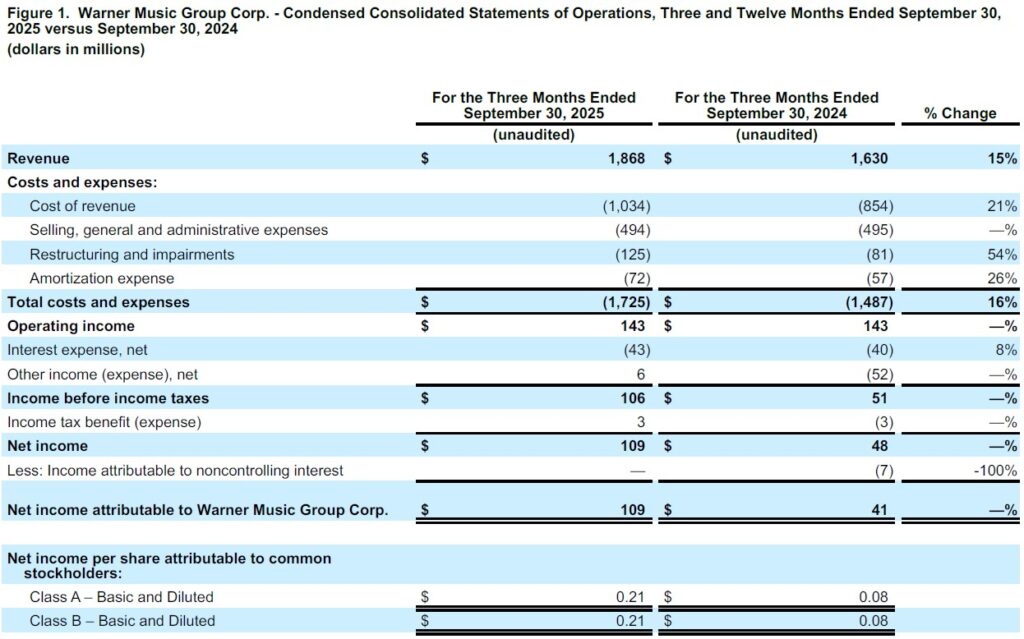
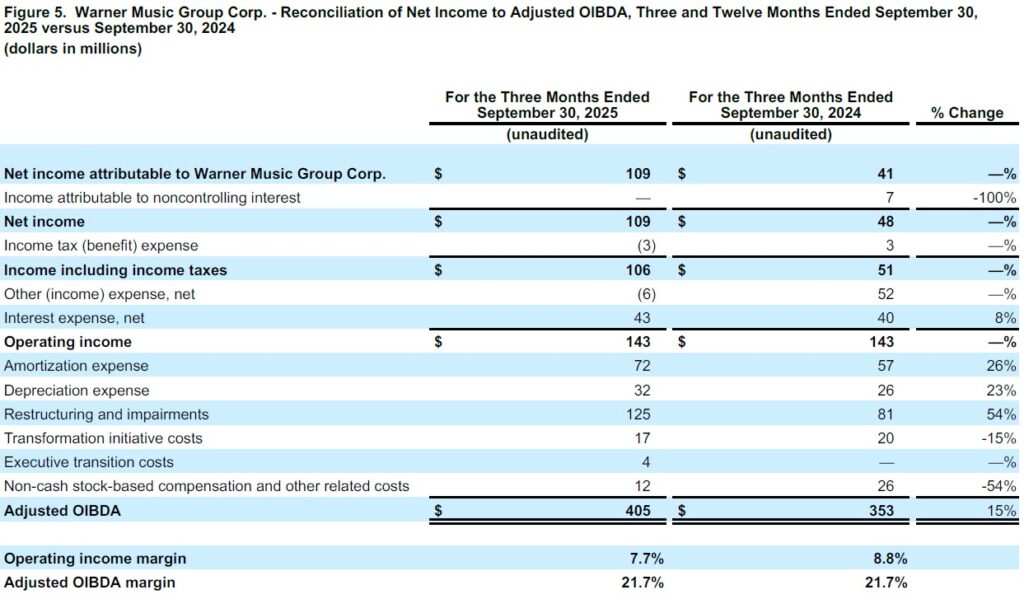
- Net income was $109 million versus $48 million in prior-year quarter
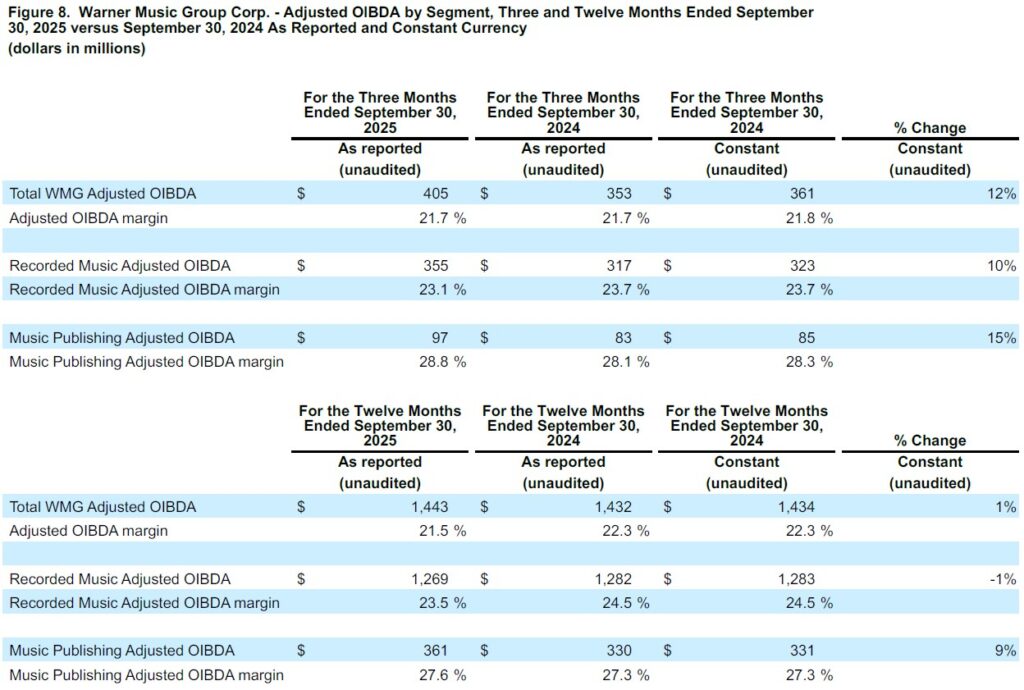
- Adjusted OIBDA increased 15% to $405 million versus $353 million in prior-year quarter (or 12% in constant currency)
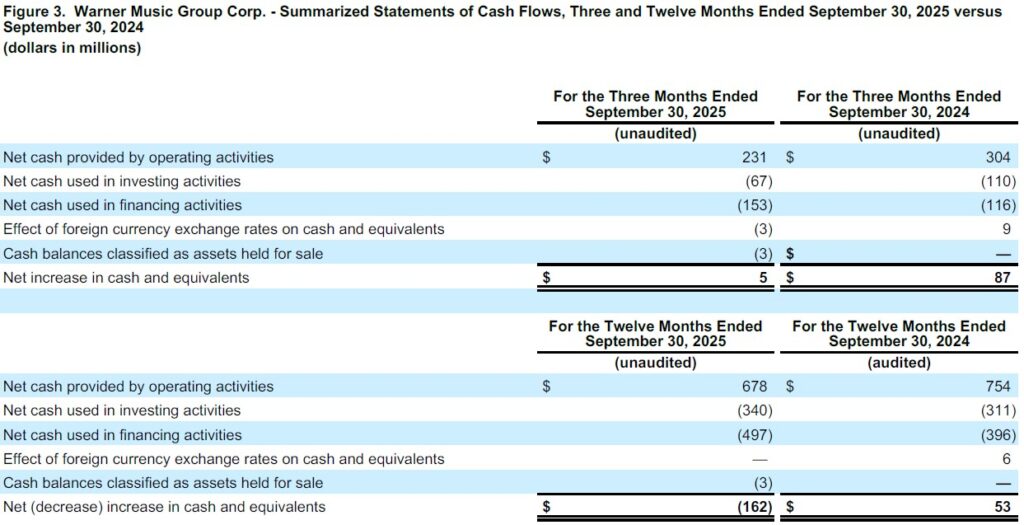
- Cash provided by operating activities decreased 24% to $231 million from $304 million in prior-year quarter
For the twelve months ended September 30, 2025
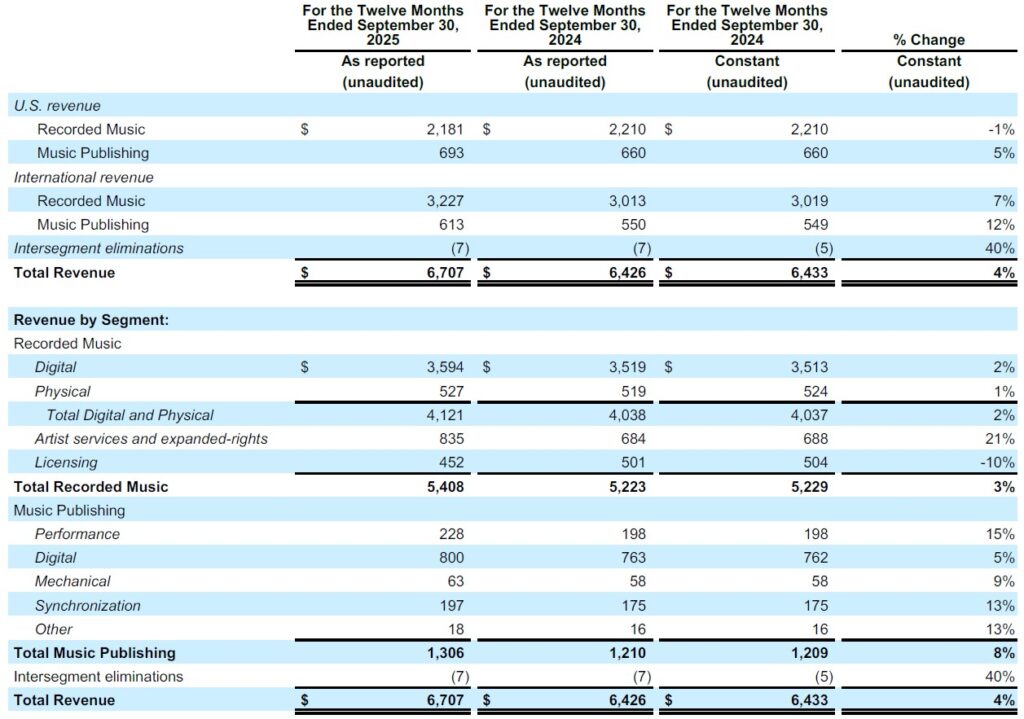
- Total revenue increased 4%, the same in constant currency
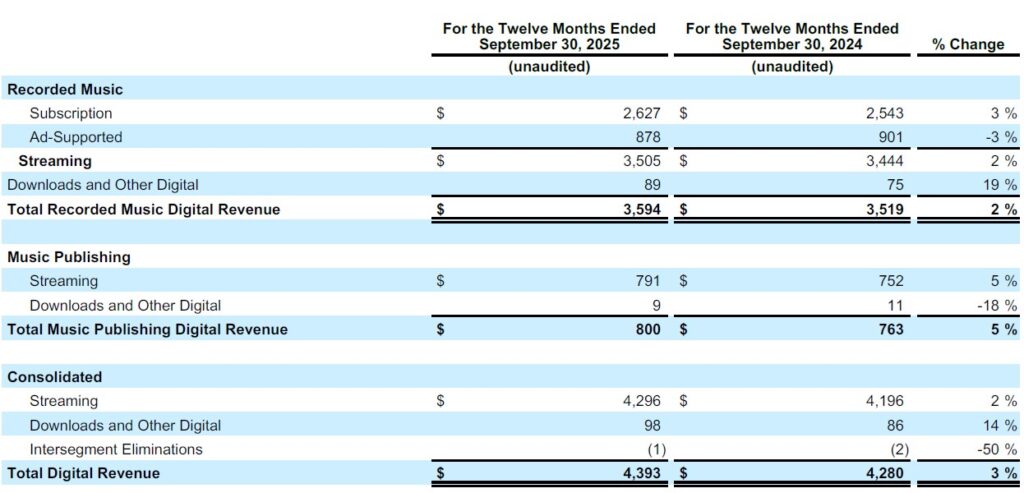
- Digital revenue increased 3%, the same in constant currency
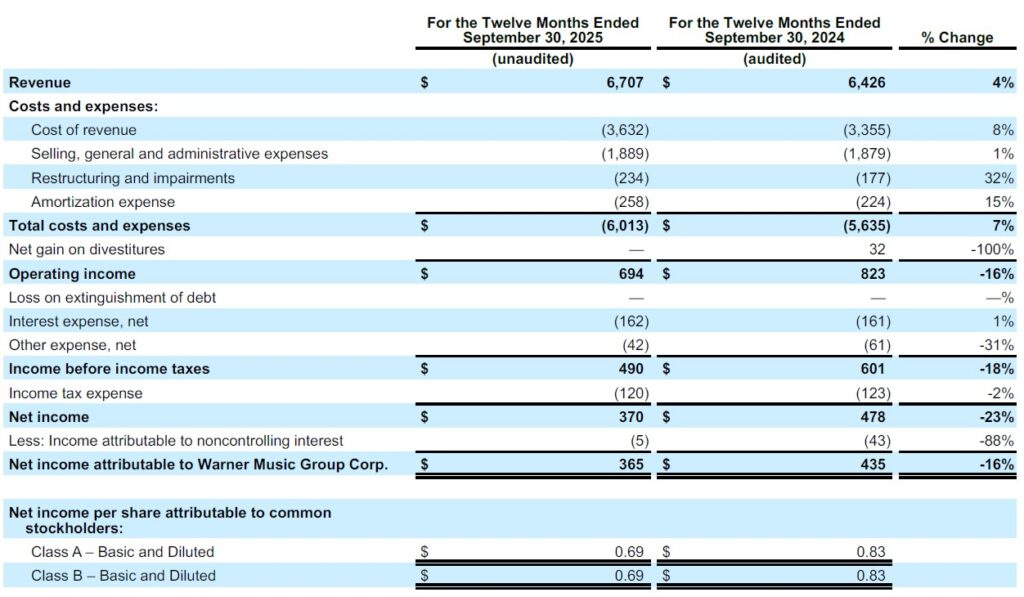
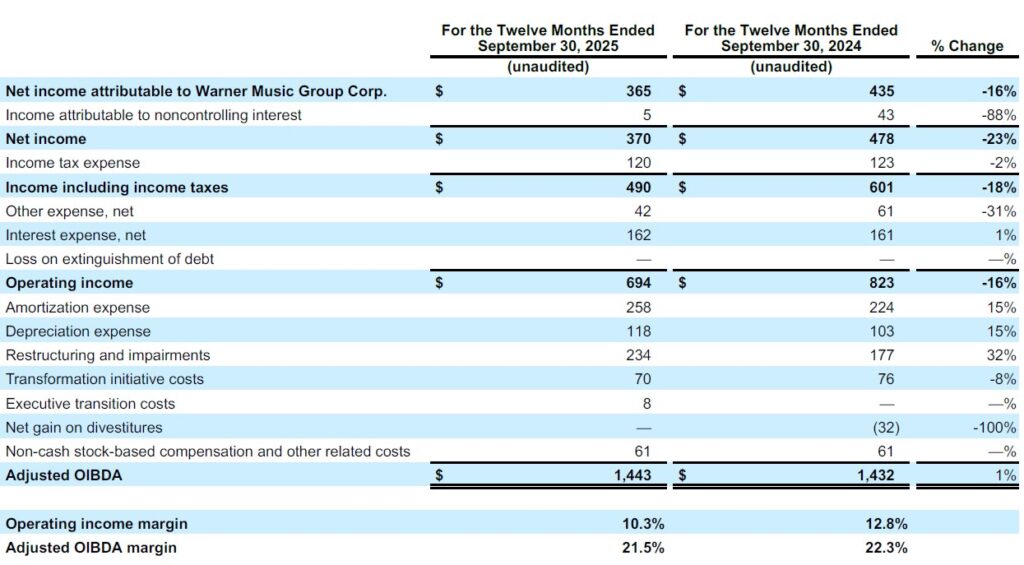
- Net income was $370 million versus $478 million in prior year
- Adjusted OIBDA increased 1% to $1,443 million versus $1,432 million in prior year (the same in constant currency)
- Cash provided by operating activities decreased 10% to $678 million from $754 million in prior year
Warner Music Group Corp. today announced its fourth-quarter and full-year financial results for the periods ended September 30, 2025.
“With our artists and songwriters hotter than ever, market share gains drove our quarterly revenues to an all-time high,” said Robert Kyncl, CEO, Warner Music Group. “Our powerful momentum is underpinned by increasing the value of music- through volume and rate increases- and now with incremental revenue opportunities in AI.”
“We have made significant progress against our priorities to accelerate top and bottom-line growth and drive efficiency,” said Armin Zerza, CFO, Warner Music Group. “The double digit revenue jump we delivered in Q4, and our stronger second half performance, demonstrates that our strategy is working. We look forward to sustained profitable growth in 2026, as we continue to invest to deliver bigger opportunities for artists and songwriters and greater shareholder value.”
Fourth-Quarter Results
Revenue was up 14.6% (or 12.6% in constant currency). The termination of the distribution agreement with BMG (the “BMG Termination”) had a $17 million negative impact on Recorded Music revenue, of which $10 million was in streaming revenue and $7 million was in physical revenue. Excluding the BMG Termination, total revenue was up 15.8% (or 13.8% in constant currency).
Digital revenue increased 8.1% (or 6.5% in constant currency) and streaming revenue increased 7.8% (or 6.2% in constant currency). Recorded Music streaming revenue increased 7.5% (or 5.8% in constant currency); however, adjusted for the $10 million impact of the BMG Termination, Recorded Music streaming revenue was up 8.8% (or 7.0% in constant currency). Music Publishing streaming revenue increased 9.3% (or 8.2% in constant currency). Revenue increases in the quarter were also driven by growth in Recorded Music artist services and expanded-rights revenue and Music Publishing performance, mechanical and synchronization revenue, partially offset by lower Recorded Music physical and licensing revenue.
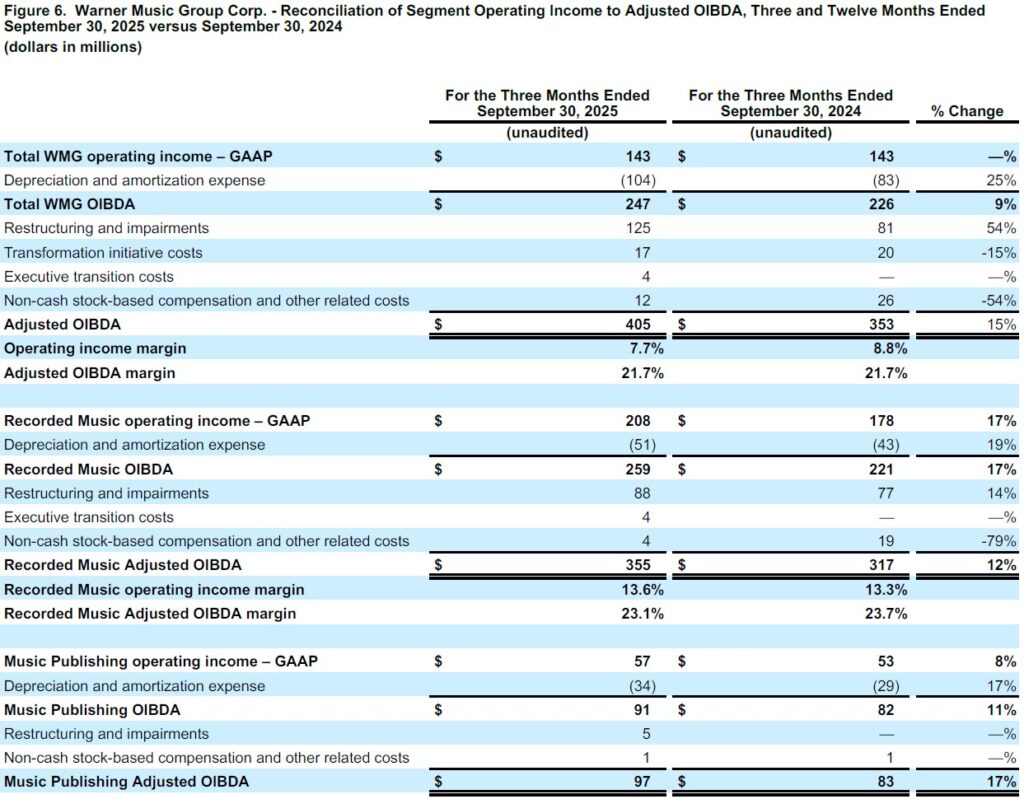
Operating income remained constant at $143 million for each of the current and prior-year quarters, primarily driven by the factors affecting Adjusted OIBDA discussed below and lower expenses related to transformation initiatives of $3 million, offset by an increase in restructuring and non-cash impairment charges of $44 million compared to the prior-year quarter, of which $35 million is in connection with the Company’s restructuring plans announced in July 2025 and February 2024, and $9 million for impairment charges on long-lived assets associated with EMP Merchandising (“EMP”), which is now classified as held for sale, as well as higher amortization expense of $15 million and higher executive transition costs of $4 million.
Adjusted OIBDA increased 14.7% from $353 million to $405 million (or 12.2% in constant currency) and Adjusted OIBDA margin remained constant at 21.7% (or decreased 0.1 percentage point to 21.7% from 21.8% in constant currency), which includes the $1 million impact of the BMG Termination in the prior year. Excluding the impact of the BMG Termination, Adjusted OIBDA increased 15.1% (or 12.5% in constant currency) and Adjusted OIBDA margin was down 0.1 percentage point to 21.7% from 21.8% in the prior-year quarter (or 0.2 percentage points to 21.7% from 21.9% in constant currency). These changes were primarily driven by revenue mix and cost savings from the Company’s restructuring plans, of which a portion has been reinvested in the Company’s business.
Net income increased by $61 million to $109 million from $48 million in the prior-year quarter. The increase was primarily due to the impact of exchange rates on the Company’s Euro-denominated debt resulting in a loss of $1 million compared to a loss of $35 million in the prior-year quarter, as well as a $12 million gain on intercompany loans compared to a $19 million loss in the prior-year quarter. The increase was also driven by a tax benefit of $3 million in the quarter compared to an expense of $3 million in the prior-year quarter driven by the impact of a change in indefinite reinvestment assertion related to EMP, partially offset by higher pre-tax income. These increases were partially offset by the factors affecting operating income described above and higher interest expense of $3 million.
Basic and Diluted earnings per share were $0.21 for both the Class A and Class B shareholders due to the net income attributable to the Company in the quarter of $109 million.
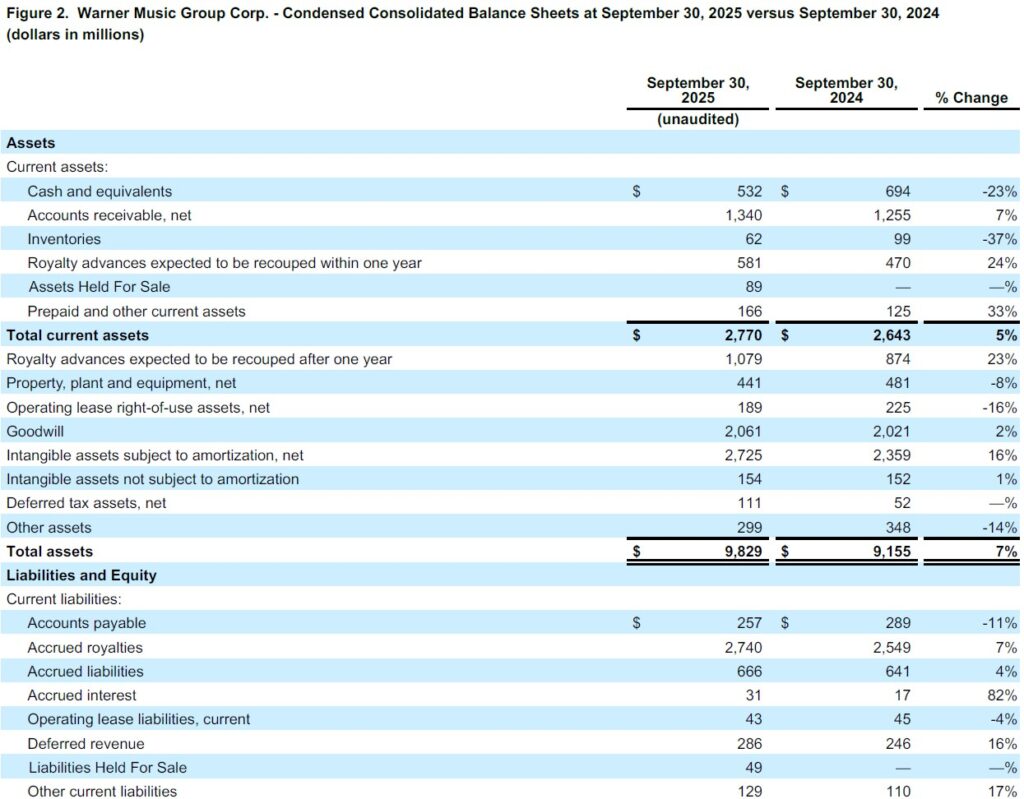
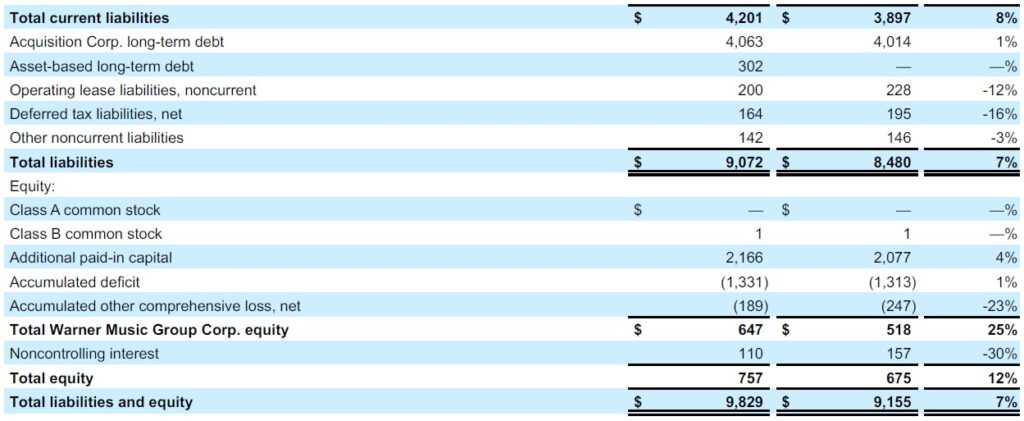
As of September 30, 2025, the Company reported a cash balance of $532 million, total debt of $4.365 billion and net debt (defined as total debt, net of deferred financing costs, premiums and discounts, minus cash and equivalents) of $3.833 billion, compared to $3.320 billion at the end of the prior year. Total debt as of September 30, 2025 includes $302 million of subsidiary debt acquired in the Company’s acquisition of Tempo Music Holdings, LLC (“Tempo Music”) in the current year. The debt is secured only by certain music rights owned by Tempo Music and is nonrecourse to the Company and its subsidiaries, other than Tempo Music.
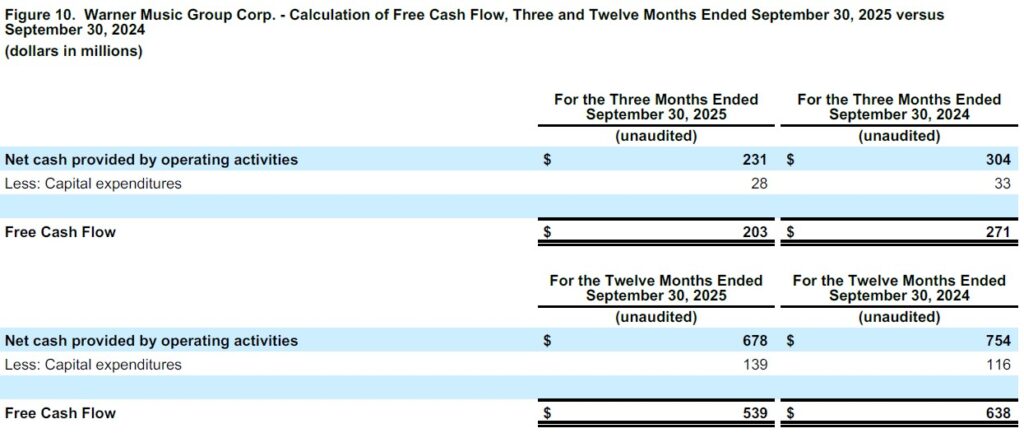
Cash provided by operating activities decreased 24% to $231 million from $304 million in the prior-year quarter. The decrease was largely the result of timing of working capital, partially offset by the timing of severance payments related to the Company’s restructuring plans. Capital expenditures decreased to $28 million, from $33 million in the prior-year quarter. Free Cash Flow, as defined below, decreased $68 million to $203 million from $271 million in the prior-year quarter.
Full-Year Results
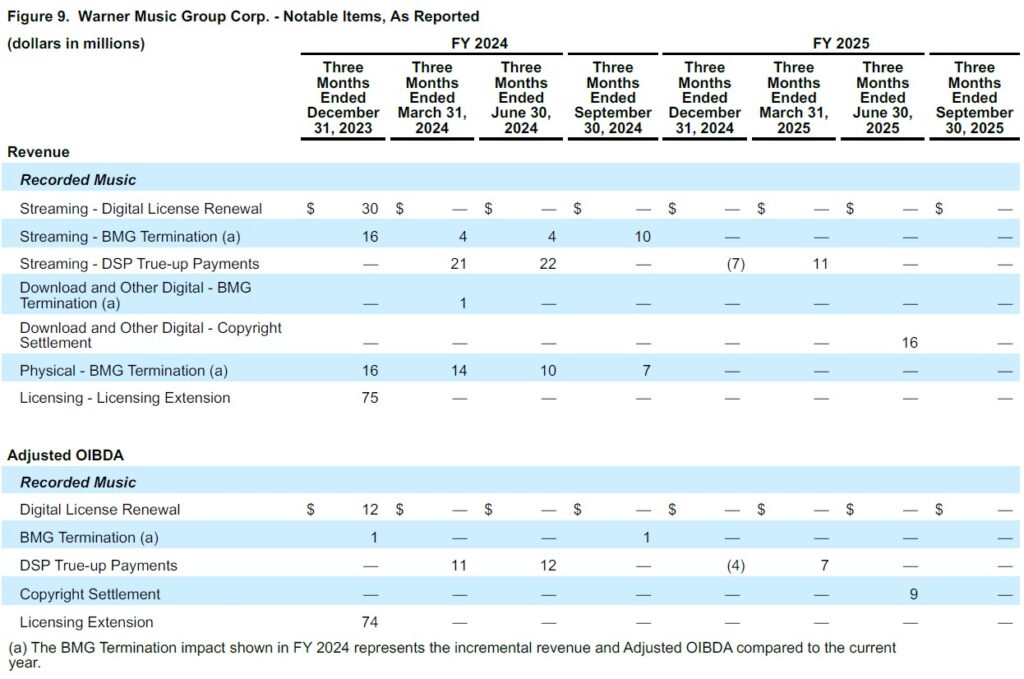
Total revenue increased 4.4% (or 4.3% in constant currency). As previously disclosed, the year includes $16 million of Recorded Music digital revenue from the settlement of certain infringement cases (the “Copyright Settlement”) and $4 million of incremental Recorded Music streaming revenue recognized from a Digital Service Provider (“DSP”) for performance obligations satisfied in previous periods (the “DSP True-Up Payments”). The prior year included $75 million of Recorded Music licensing revenue from a licensing agreement extension for an artist’s catalog (the “Licensing Extension”), $43 million of incremental revenue recognized from the DSP True-Up Payments, and $30 million of Recorded Music streaming revenue from a deal with one of the Company’s digital partners (the “Digital License Renewal”), which resulted in upfront revenue recognition in the prior year. In addition, revenue growth was unfavorably impacted by the BMG Termination, which resulted in $81 million of lower Recorded Music revenue, of which $34 million was in streaming revenue and $47 million was in physical revenue. Adjusted for these items, total revenue was up 7.9% (or 7.7% in constant currency).
Digital revenue increased 2.6% (or 2.8% in constant currency) and streaming revenue increased 2.4% (or 2.5% in constant currency). Recorded Music streaming revenue increased 1.8% (or 1.9% in constant currency). Adjusted for the impacts of the DSP True-Up Payments of $4 million in the current year and $43 million in the prior year, as well as the BMG Termination of $34 million and the Digital License Renewal of $30 million in the prior year, Recorded Music streaming revenue increased 4.9% (or 5.0% in constant currency). Music Publishing streaming revenue increased 5.2% (the same in constant currency). Revenue increases in the year were also driven by growth in Recorded Music artist services and expanded-rights and physical revenue and Music Publishing performance, mechanical and synchronization revenue, partially offset by lower Recorded Music licensing revenue, driven by the impact of the Licensing Extension of $75 million in the prior year.
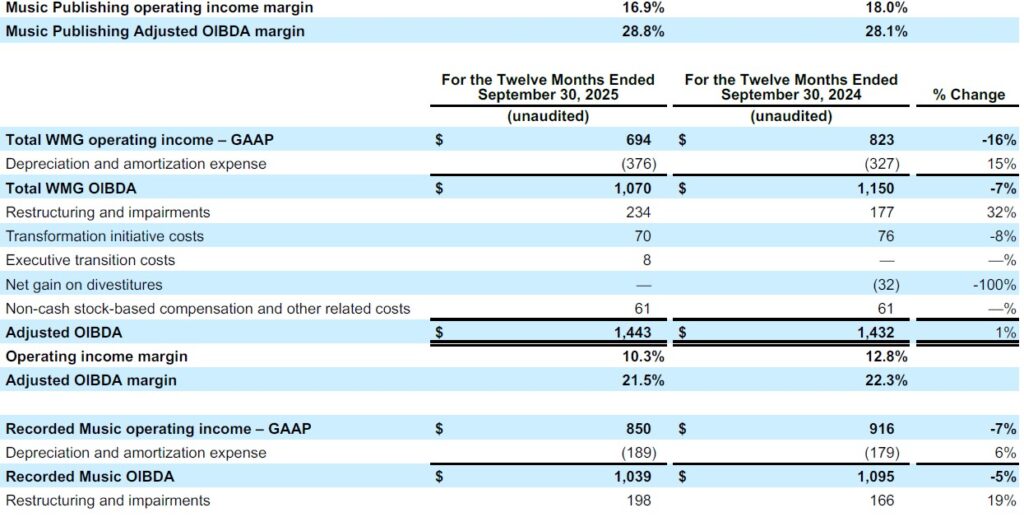
Operating income decreased by $129 million to $694 million compared to $823 million in the prior year. The decrease in operating income was primarily due to revenue mix, an increase in restructuring and non-cash impairment charges of $57 million, driven by $79 million of impairment charges related to long-lived assets associated with EMP, which is now classified as held for sale, partially offset by lower restructuring costs of $32 million related to the Company’s restructuring plans, $34 million of higher amortization expenses due to intangibles established as part of the Company’s acquisitions and a $32 million decrease in net gain on divestitures, partially offset by factors that led to the increase in Adjusted OIBDA noted below.
Adjusted OIBDA increased 0.8% to $1,443 million from $1,432 million (or 0.6% in constant currency). Adjusted OIBDA margin decreased 0.8 percentage points to 21.5% from 22.3% in the prior year (the same in constant currency). The changes in Adjusted OIBDA and Adjusted OIBDA margin include the impacts of the Copyright Settlement of $9 million and DSP True-Up Payments of $3 million in the current year, offset by the Licensing Extension of $74 million, the DSP True-Up Payments of $23 million, the Digital License Renewal of $12 million and the BMG Termination of $2 million in the prior year. Excluding the impact of these items, Adjusted OIBDA increased 8.3% (or 8.0% in constant currency) and Adjusted OIBDA margin increased 0.1 percentage point to 21.4% from 21.3% in the prior year (the same in constant currency), primarily due to cost savings from the Company’s restructuring plans, a portion of which has been reinvested in the Company’s business.
Net income decreased by $108 million to $370 million compared to $478 million in the prior year. The decrease in net income was primarily due to the factors described above, partially offset by lower income tax expense of $3 million due to a decrease in pre-tax income.
Basic and Diluted earnings per share were $0.69 for both the Class A and Class B shareholders due to the net income attributable to the Company in the year of $370 million.
Cash provided by operating activities decreased 10% to $678 million from $754 million in the prior year. The change was largely a result of timing of working capital, including the timing of severance payments related to the Company’s restructuring plans. Operating cash flow conversion was 47% of Adjusted OIBDA. Capital expenditures increased 20% to $139 million from $116 million in the prior year. Free Cash Flow, as defined below, decreased $99 million to $539 million from $638 million in the prior year.
Fourth-Quarter Results
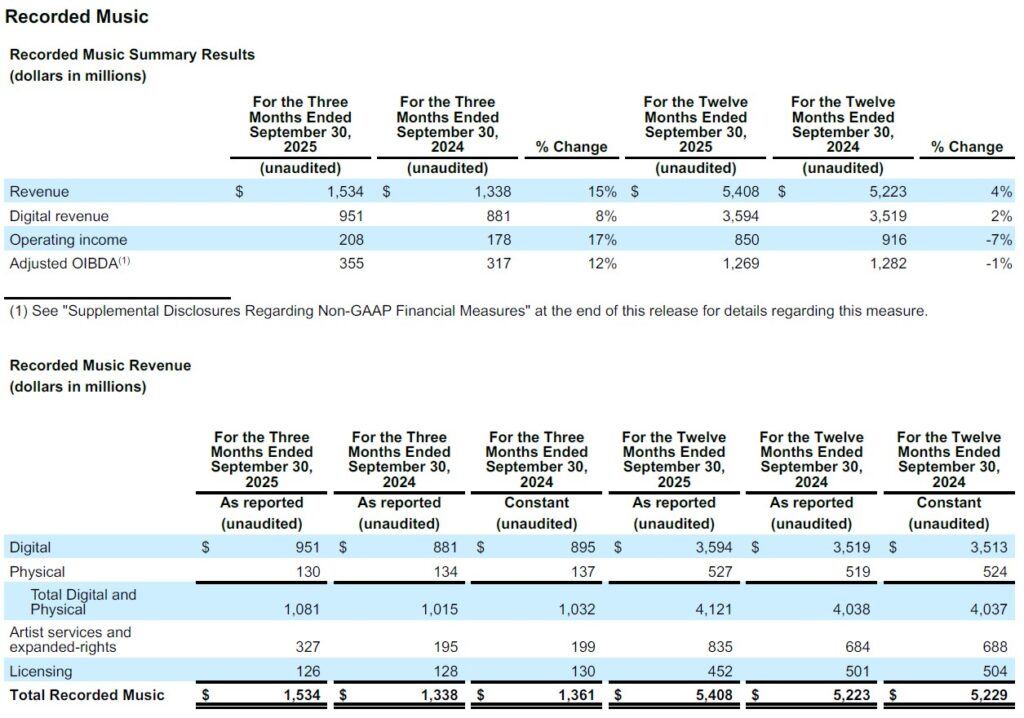
Recorded Music revenue was up 14.6% (or 12.7% in constant currency), driven by growth across digital and artist services and expanded-rights revenue, partially offset by decreases in physical and licensing revenue. Excluding the impact of the BMG Termination, Recorded Music revenue increased 16.1% (or 14.1% in constant currency). Digital revenue was up 7.9% (or 6.3% in constant currency), and streaming revenue was up 7.5% (or 5.8% in constant currency). Adjusted for the impact of the BMG Termination of $10 million, Recorded Music streaming revenue was up 8.8% (or 7.0% in constant currency). Streaming revenue reflects growth in subscription revenue of 8.5% (or 7.0% in constant currency), and in ad-supported revenue of 4.5% (or 2.2% in constant currency). Subscription revenue, adjusted by $8 million for the BMG Termination, increased 9.9% (or 8.4% in constant currency). Ad-supported revenue, adjusted by $2 million for the BMG Termination, increased 5.5% (or 3.1% in constant currency). The increase in subscription revenue reflected positive market share trends and chart performance, while the increase in ad-supported revenue reflects strong performance and the timing of certain payments in the quarter. Artist services and expanded-rights revenue increased 67.7% (or 64.3% in constant currency) primarily due to higher merchandising revenue from the Company’s partnership with Oasis and higher concert promotion revenue. Recorded Music licensing revenue decreased 1.6% (or 3.1% in constant currency), due to the timing of licensing deals. Physical revenue decreased 3.0% (or 5.1% in constant currency) primarily driven by the $7 million impact of the BMG Termination in the prior-year quarter. Excluding the impact of the BMG Termination, physical revenue increased 2.4% (or remained constant in constant currency) primarily due to strong releases in the United States. Major sellers in the quarter included Alex Warren, Ed Sheeran, twenty one pilots, Teddy Swims and sombr.
Recorded Music operating income was $208 million, up from $178 million in the prior-year quarter and operating margin was up 0.3 percentage points to 13.6% versus 13.3% in the prior-year quarter. The increase in operating income and operating income margin was driven by the factors affecting Adjusted OIBDA discussed below and lower non-cash stock-based compensation expenses and other related costs of $15 million, partially offset by an increase in restructuring and non-cash impairment charges of $11 million, which includes $9 million of impairment charges on long-lived assets associated with EMP, which is now held for sale, and higher impairment recognized in connection with the Company’s restructuring plans, and a $9 million increase in amortization expense due to an increase in assets from acquisitions.
Adjusted OIBDA increased 12.0% from $317 million to $355 million (or 9.9% in constant currency), while Adjusted OIBDA margin was down 0.6 percentage points to 23.1% from 23.7% in the prior-year quarter (the same in constant currency). Excluding the BMG Termination, Adjusted OIBDA increased 12.3% from $316 million to $355 million (or 10.2% in constant currency), while Adjusted OIBDA margin was down 0.8 percentage points to 23.1% from 23.9% (or 0.9 percentage points from 24.0% in constant currency). The changes in Adjusted OIBDA and Adjusted OIBDA margin were primarily driven by savings from the Company’s restructuring plans, a portion of which was reinvested into the Company’s business.
Full-Year Results
Recorded Music revenue was up 3.5% (or 3.4% in constant currency), largely driven by growth in artist services and expanded-rights revenue of 22.1% (or 21.4% in constant currency), reflecting higher merchandising revenue, which includes the favorable impact of the Company’s partnership with Oasis, the impact of acquisitions and higher concert promotion revenue, as well as growth in digital revenue of 2.1% (or 2.3% in constant currency), largely driven by growth in streaming revenue of 1.8% (or 1.9% in constant currency) and download and other digital revenue of 18.7% (the same in constant currency). Adjusted for the impacts of the DSP True-Up Payments of $4 million in the current year and $43 million in the prior year, as well as the BMG Termination of $34 million and the Digital License Renewal of $30 million in the prior year, Recorded Music streaming revenue was up 4.9% (or 5.0% in constant currency). Streaming revenue reflects growth in subscription revenue of 3.3% (or 3.6% in constant currency), partially offset by a decline in ad-supported revenue of 2.6% (the same in constant currency). Adjusted for the impacts of the DSP True-Up Payments of $4 million in the current year and $43 million in the prior year, as well as the BMG Termination of $31 million and the Digital License Renewal of $30 million, subscription revenue increased 7.5% (or 7.7% in constant currency). Adjusted for the impact of the BMG Termination of $3 million, ad-supported revenue decreased 2.2% (the same in constant currency). The increase in subscription revenue reflects positive market share trends, while the decrease in ad-supported revenue was driven by a soft overall ad environment during the year. Adjusted for the impact of the Copyright Settlement of $16 million in the current year, download and other digital revenue decreased 2.7% (the same in constant currency). Physical revenue increased 1.5% (or 0.6% in constant currency), which includes the $47 million impact of the BMG Termination in the prior year. Adjusted for the BMG Termination, physical revenue increased 11.7% (or 10.5% in constant currency). These increases were partially offset by a decrease in licensing revenue of 9.8% (or 10.3% in constant currency), which includes the $75 million impact of the Licensing Extension in the prior year. Adjusted for the Licensing Extension, licensing revenue increased 6.1% (or 5.4% in constant currency). Major sellers in the year included ROSÉ, Bruno Mars, Linkin Park, Teddy Swims, Benson Boone and Charli XCX.
Recorded Music operating income decreased to $850 million from $916 million in the prior year, and operating margin was down 1.8 percentage points to 15.7% from 17.5% in the prior year. The decrease in operating income was primarily due to the factors affecting Adjusted OIBDA discussed below, as well as an increase in restructuring and non-cash impairment charges of $32 million, which includes $79 million of impairment charges recognized for long-lived assets associated with EMP, which is now held for sale, partially offset by lower restructuring and impairment charges in connection with the Company’s restructuring plans, a $17 million decrease in net gain on divestitures and a $9 million increase in amortization expense due to an increase in assets from acquisitions.
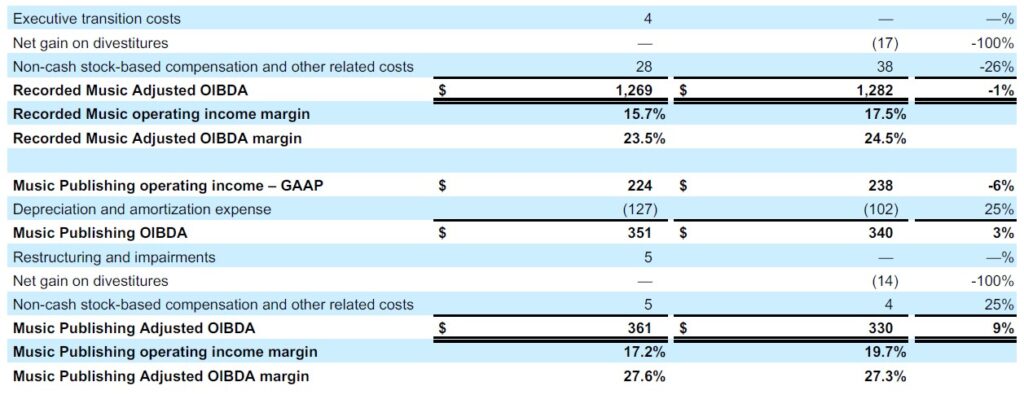
Adjusted OIBDA decreased 1.0% to $1,269 million from $1,282 million (or 1.1% in constant currency) and Adjusted OIBDA margin was down 1.0 percentage point to 23.5% from 24.5% (the same in constant currency). The decreases in Adjusted OIBDA and Adjusted OIBDA margin include the impacts of the Copyright Settlement of $9 million and the DSP True-Up Payments of $3 million in the current year, partially offset by the Licensing Extension of $74 million, the DSP True-Up Payments of $23 million, the Digital License Renewal of $12 million and $2 million from the BMG Termination in the prior year. Excluding the impact of these items, Adjusted OIBDA increased 7.3% (or 7.0% in constant currency) and Adjusted OIBDA margin decreased 0.1 percentage point to 23.3% from 23.4% (or 0.2 percentage points to 23.3% from 23.5% in constant currency) primarily due to cost savings from the Company’s restructuring plans, a portion of which was reinvested into the Company’s business.
Fourth-Quarter Results
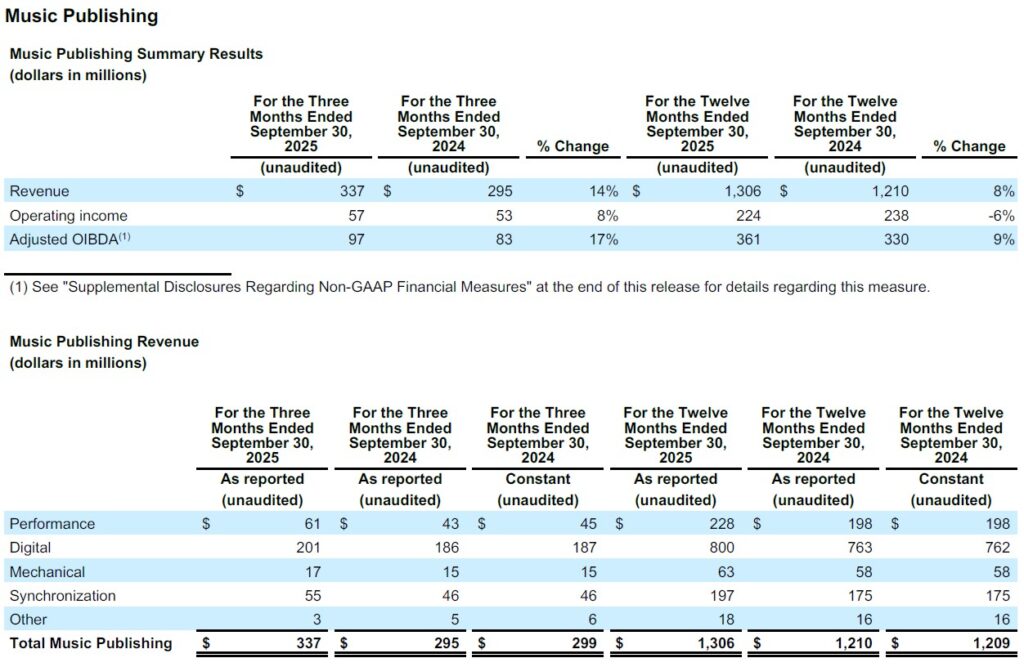
Music Publishing revenue increased 14.2% (or 12.7% in constant currency), driven by higher performance, digital, mechanical and synchronization revenue. Digital revenue increased 8.1% (or 7.5% in constant currency) and streaming revenue increased 9.3% (or 8.2% in constant currency), which reflected continued market and catalog growth. Performance revenue increased 41.9% (or 35.6% in constant currency) driven by an increase in concerts, radio and live events, as well as the timing of payments from collection societies. Synchronization revenue was up 19.6% (the same in constant currency), driven by an increase in copyright infringement settlements primarily in the United States and the impact of the Company’s acquisitions, including Tempo Music of $3 million. Mechanical revenue also increased 13.3% (the same in constant currency).
Music Publishing operating income increased to $57 million compared to $53 million in the prior-year quarter and operating margin decreased 1.1 percentage points to 16.9% versus 18.0% in the prior-year quarter. The increase in operating income was primarily driven by the same factors affecting Adjusted OIBDA discussed below, partially offset by higher amortization expense of $6 million related to various music publishing copyright acquisitions in the quarter.
Adjusted OIBDA increased 16.9% to $97 million from $83 million (or 14.7% in constant currency) and Adjusted OIBDA margin increased 0.7 percentage points to 28.8% from 28.1% in the prior-year quarter (or 0.5 percentage points to 28.8% from 28.3% in constant currency). The increases in Adjusted OIBDA and Adjusted OIBDA margin were primarily driven by revenue mix, partially offset by $5 million of restructuring and non-cash impairment charges in the quarter.
Full-Year Results
Music Publishing revenue increased 7.9% (or 8.0% in constant currency) driven by growth in performance, digital, mechanical and synchronization revenue. Digital revenue increased 4.8% (or 5.0% in constant currency), driven by growth in streaming revenue of 5.2% (the same in constant currency). Music Publishing streaming growth reflected continued catalog growth and the impact of digital deal renewals. Performance revenue increased 15.2% (the same in constant currency) attributable to growth from concerts, radio, live and non-live events. Synchronization revenue increased 12.6% (the same in constant currency) driven by the timing of copyright infringement settlements primarily in the United States and the $8 million impact of the Company’s acquisition of Tempo Music. Mechanical revenue increased 8.6% (the same in constant currency).
Music Publishing operating income decreased to $224 million from $238 million in the prior year and operating margin decreased 2.5 percentage points to 17.2% versus 19.7%, primarily driven by the same factors affecting Adjusted OIBDA discussed below, partially offset by an increase in amortization expense of $24 million related to various music publishing copyright acquisitions and the impact of a net gain on a divestiture of $14 million in the prior year.
Adjusted OIBDA increased 9.4% to $361 million from $330 million (or 9.2% in constant currency) and Adjusted OIBDA margin increased 0.3 percentage points to 27.6% from 27.3% (the same in constant currency). The increases in Adjusted OIBDA and Adjusted OIBDA margin were primarily driven by revenue mix, partially offset by $5 million of restructuring and non-cash impairment charges in the current year.
This morning, management will be hosting a conference call to discuss the results at 8:30 A.M. EST. The call will be webcast on www.wmg.com.
About Warner Music Group
With a legacy extending back over 200 years, Warner Music Group today is home to an unparalleled family of creative artists, songwriters, and companies that are moving culture across the globe. At the core of WMG’s Recorded Music division are four of the most iconic companies in history: Atlantic, Elektra, Parlophone and Warner Records. They are joined by renowned labels such as TenThousand Projects, 300 Entertainment, Asylum, Big Beat, Canvasback, East West, Erato, FFRR, Fueled by Ramen, Nonesuch, Reprise, Rhino, Roadrunner, Sire, Spinnin’ Records, Warner Classics and Warner Music Nashville. Warner Chappell Music – which traces its origins back to the founding of Chappell & Company in 1811 – is one of the world’s leading music publishers, with a catalog of more than one million copyrights spanning every musical genre from the standards of the Great American Songbook to the biggest hits of the 21st century.
“Safe Harbor” Statement under Private Securities Litigation Reform Act of 1995
This communication includes forward-looking statements that reflect the current views of Warner Music Group about future events and financial performance. Words such as “estimates,” “expects,” “anticipates,” “projects,” “plans,” “intends,” “believes,” “forecasts” and variations of such words or similar expressions that predict or indicate future events or trends, or that do not relate to historical matters, identify forward-looking statements. All forward-looking statements are made as of today, and we disclaim any duty to update such statements. Our expectations, beliefs and projections are expressed in good faith, and we believe there is a reasonable basis for them. However, we cannot assure you that management’s expectations, beliefs and projections will result or be achieved. Investors should not rely on forward-looking statements because they are subject to a variety of risks, uncertainties, and other factors that could cause actual results to differ materially from our expectations. Please refer to our Form 10-K, Form 10-Qs and our other filings with the U.S. Securities and Exchange Commission concerning factors that could cause actual results to differ materially from those described in our forward-looking statements.
We maintain an Internet site at www.wmg.com. We use our website as a channel of distribution for material company information. Financial and other material information regarding Warner Music Group is routinely posted on and accessible at http://investors.wmg.com. In addition, you may automatically receive email alerts and other information about Warner Music Group by enrolling your email address through the “email alerts” section at http://investors.wmg.com. Our website and the information posted on it or connected to it shall not be deemed to be incorporated by reference into this communication.
Supplemental Disclosures Regarding Non-GAAP Financial Measures
We evaluate our operating performance based on several factors, including the following non-GAAP financial measures:
Adjusted OIBDA
We allocate resources and evaluate performance based on several factors, including Adjusted OIBDA. We define Adjusted OIBDA as operating income (loss) adjusted to exclude the following items: (i) non-cash depreciation of tangible assets, (ii) non-cash amortization of intangible assets, (iii) non-cash stock-based compensation and other related expenses, (iv) gains or losses on divestitures, (v) expenses related to restructuring and transformation initiatives, which includes costs associated with the Company’s financial transformation initiative to design and implement new information technology and upgrade our finance infrastructure, and (vi) executive transition costs. Items excluded are not viewed to contribute directly to management’s evaluation of operating results. We consider Adjusted OIBDA to be an important indicator of the operational strengths and performance of our businesses. However, a limitation of the use of Adjusted OIBDA as a performance measure is that it does not reflect the periodic costs of certain capitalized tangible and intangible assets used in generating revenues in our businesses. Accordingly, Adjusted OIBDA should be considered in addition to, not as a substitute for, operating income (loss), net income (loss) attributable to Warner Music Group Corp. and other measures of financial performance reported in accordance with United States generally accepted accounting principles (“U.S. GAAP”). In addition, our definition of Adjusted OIBDA may differ from similarly titled measures used by other companies.
Constant Currency
Because exchange rates are an important factor in understanding period-to-period comparisons, we believe the presentation of revenue on a constant-currency basis in addition to reported revenue helps improve the ability to understand our operating results and evaluate our performance in comparison to prior periods. Constant-currency information compares results between periods as if exchange rates had remained constant period over period. We use results on a constant-currency basis as one measure to evaluate our performance. We calculate constant-currency results by applying current-year foreign currency exchange rates to prior-year results. However, a limitation of the use of the constant-currency results as a performance measure is that it does not reflect the impact of exchange rates on our revenue. These results should be considered in addition to, not as a substitute for, results reported in accordance with U.S. GAAP. Results on a constant-currency basis, as we present them, may not be comparable to similarly titled measures used by other companies and are not a measure of performance presented in accordance with U.S. GAAP.
Free Cash Flow
Our definition of Free Cash Flow is defined as cash flow provided by operating activities less capital expenditures. We use Free Cash Flow, among other measures, to evaluate our operating performance. Management believes Free Cash Flow provides investors with an important perspective on the cash available to fund our debt service requirements, ongoing working capital requirements, capital expenditure requirements, strategic acquisitions and investments, and any dividends, prepayments of debt or repurchases or retirement of our outstanding debt or notes in open market purchases, privately negotiated purchases, any repurchases of our common stock or otherwise. As a result, Free Cash Flow is a significant measure of our ability to generate long-term value. It is useful for investors to know whether this ability is being enhanced or degraded as a result of our operating performance. We believe the presentation of Free Cash Flow is relevant and useful for investors because it allows investors to view performance in a manner similar to the method management uses.
Free Cash Flow is not a measure of performance calculated in accordance with U.S. GAAP and therefore it should not be considered in isolation of, or as a substitute for, net income (loss) as an indicator of operating performance or cash flow provided by operating activities as a measure of liquidity. Free Cash Flow, as we calculate it, may not be comparable to similarly titled measures employed by other companies. In addition, Free Cash Flow does not necessarily represent funds available for discretionary use and is not necessarily a measure of our ability to fund our cash needs. Because Free Cash Flow deducts capital expenditures from “net cash provided by operating activities” (the most directly comparable U.S. GAAP financial measure), users of this information should consider the types of events and transactions that are not reflected. We provide below a reconciliation of Free Cash Flow to the most directly comparable amount reported under U.S. GAAP, which is “net cash provided by operating activities.”