Financial Highlights
- Underlying Growth in Recorded Music Streaming Revenue Despite a Challenged Macroeconomic Environment
- Continued Momentum in Music Publishing Drives Double-Digit Revenue Growth
- Adjusted OIBDA Growth and Margin Improvement Underpinned by Financial Discipline
- Cost Savings to be Reinvested in Tech-Focused Initiatives and Expertise to Drive Long-Term Growth
For the three months ended March 31, 2023
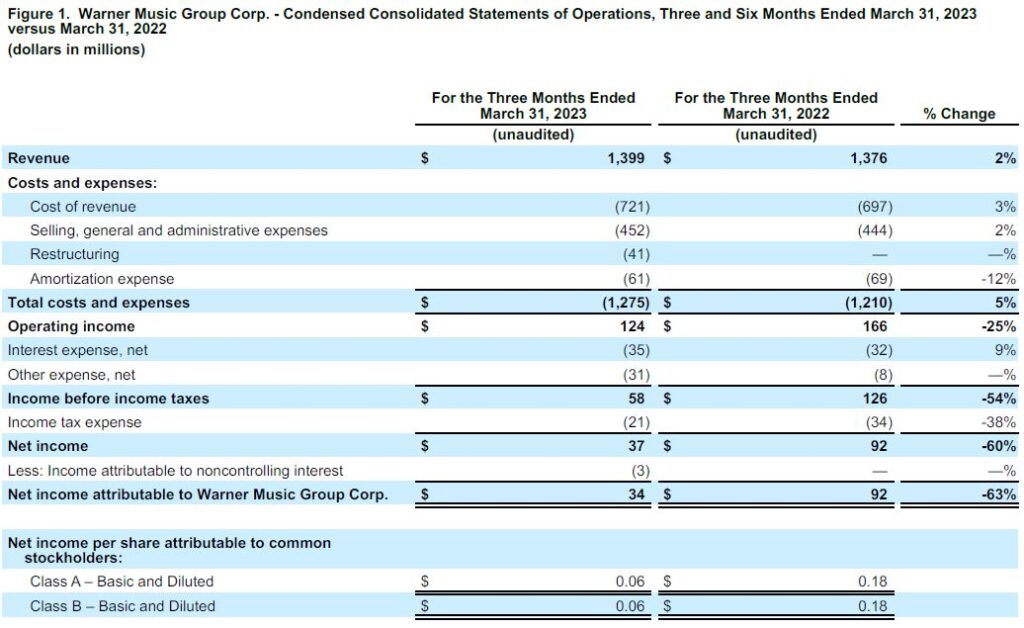
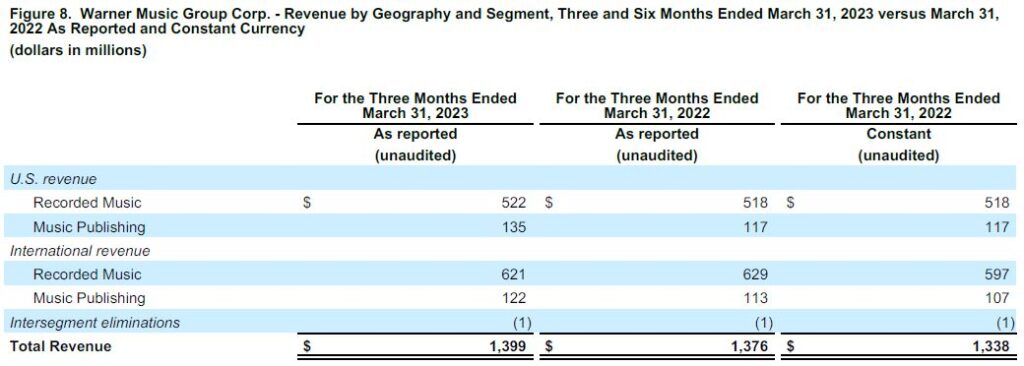
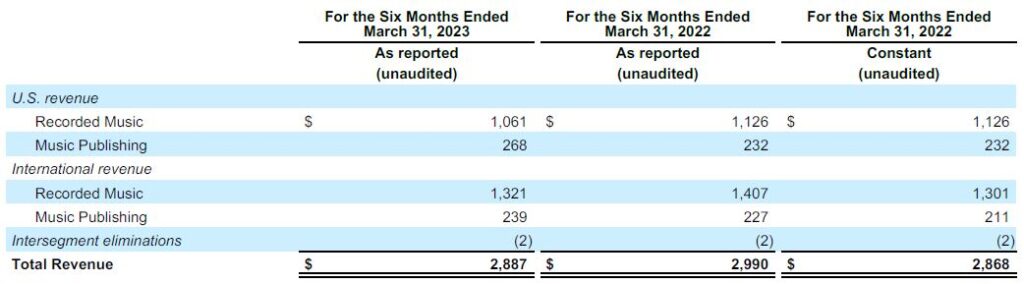
- Total revenue increased 2% or 5% in constant currency
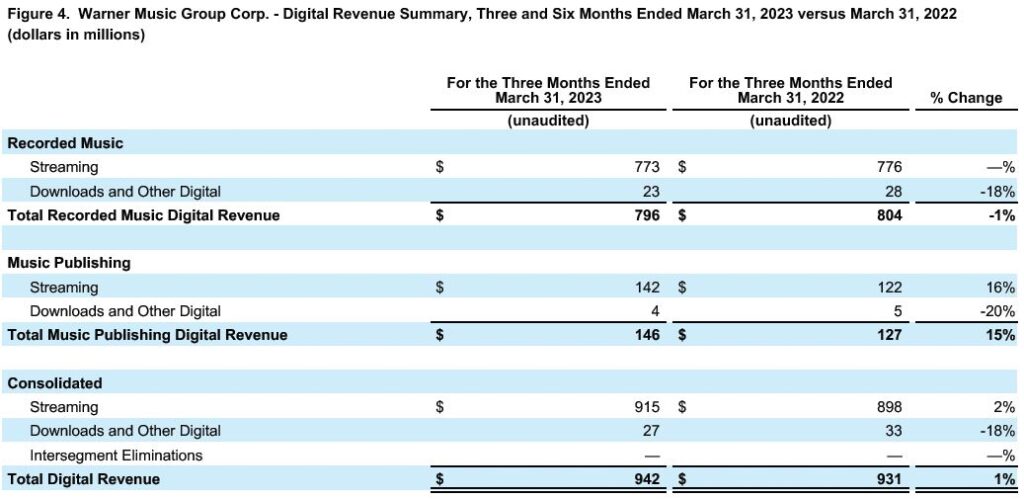
- Digital revenue increased 1% or 4% in constant currency
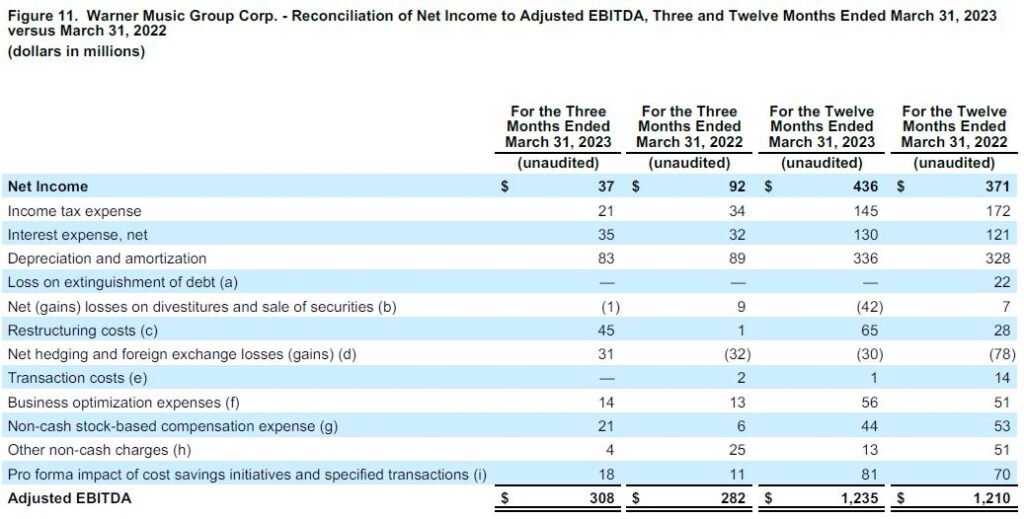
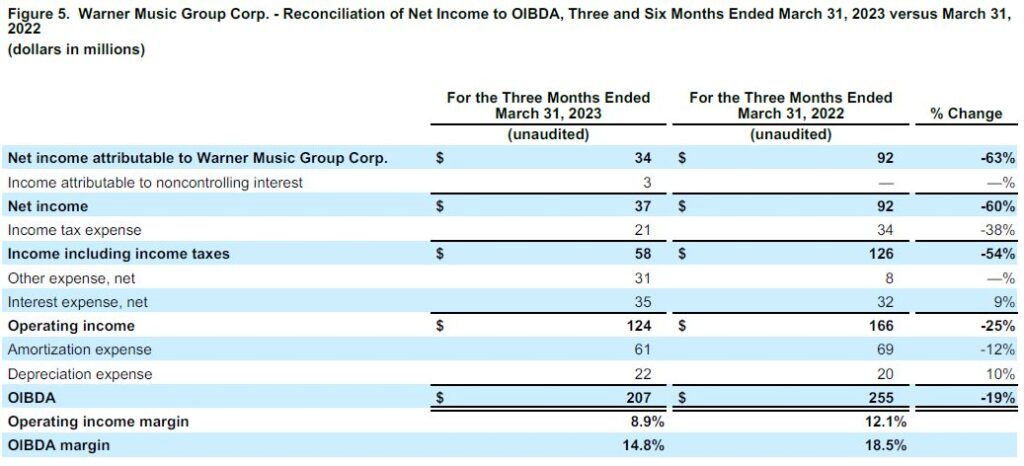
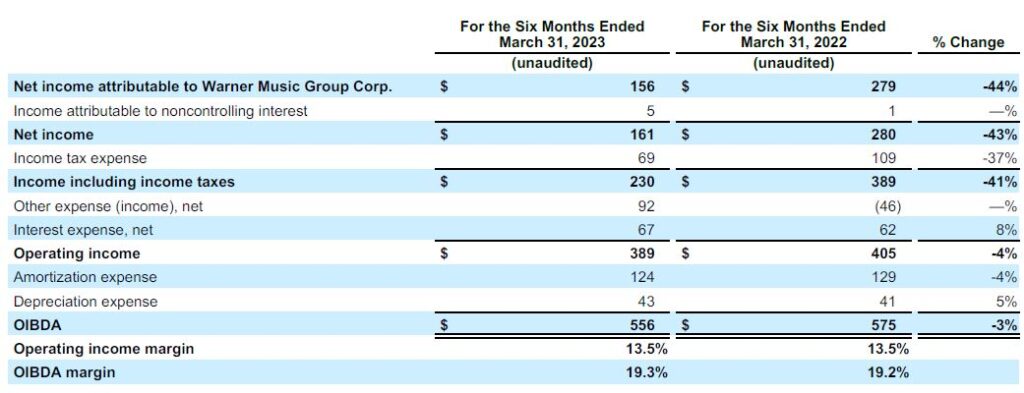
- Net income was $37 million versus $92 million in the prior-year quarter
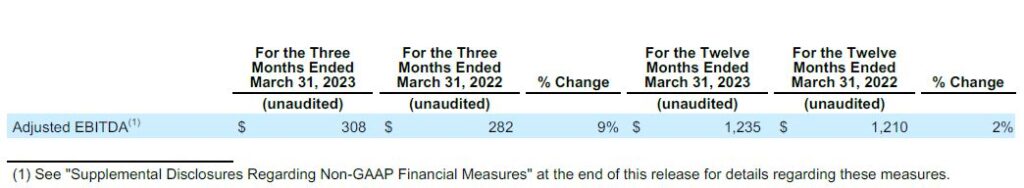
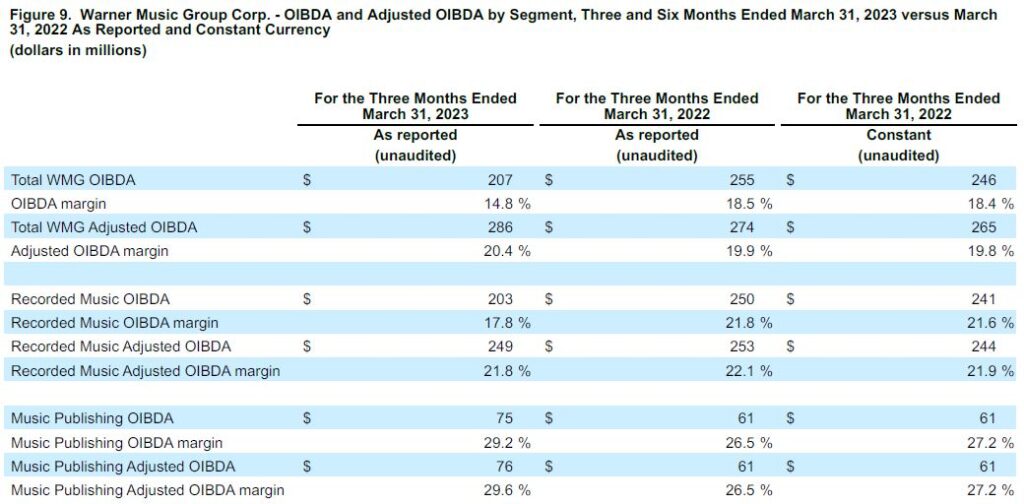
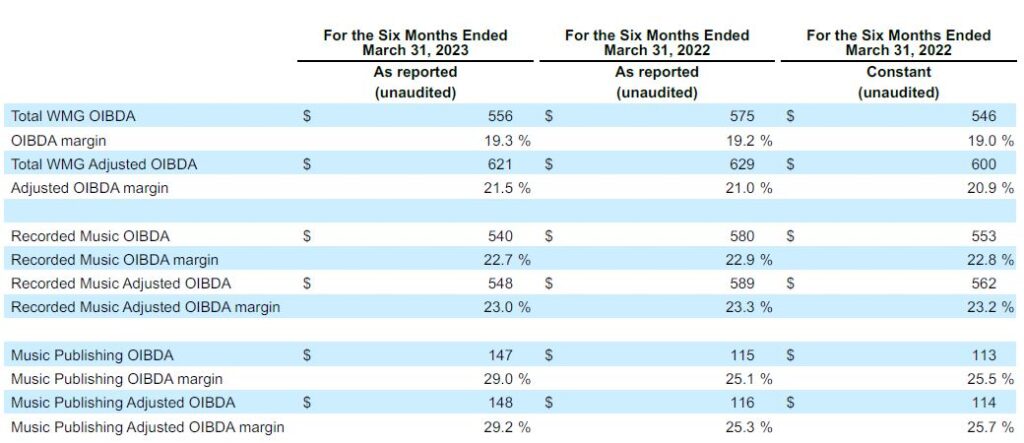
- OIBDA decreased 19% to $207 million versus $255 million in the prior-year quarter or 16% in constant currency
- Adjusted OIBDA increased 4% to $286 million versus $274 million in the prior-year quarter or 8% in constant currency
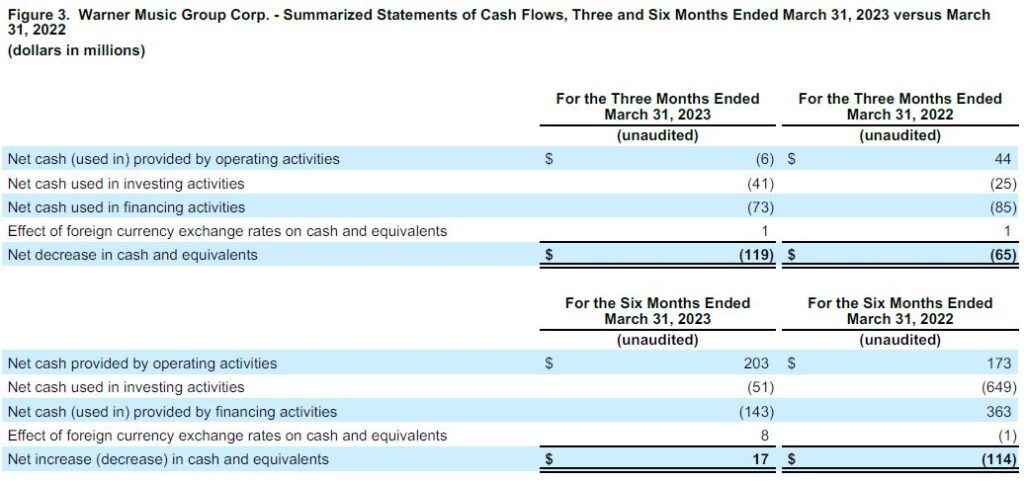
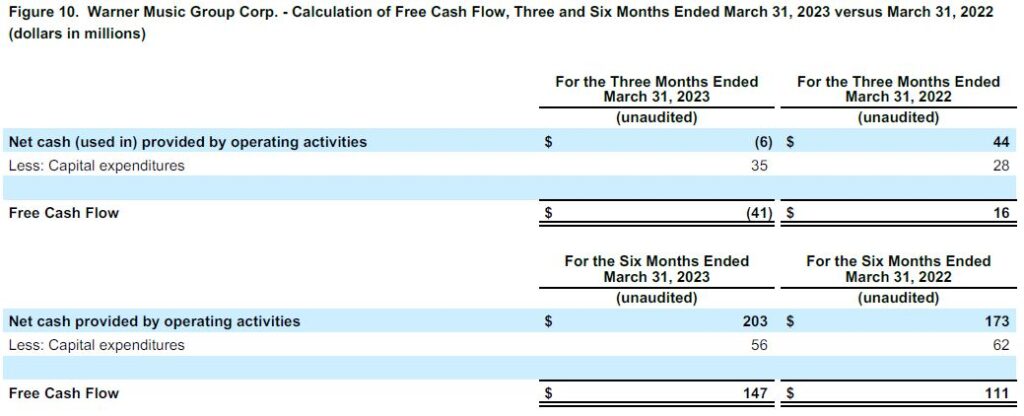
- Cash from operating activities decreased 114% to a use of $6 million versus a source of $44 million in the prior-year quarter
NEW YORK, New York, May 9, 2023—Warner Music Group Corp. today announced its second-quarter financial results for the period ended March 31, 2023.
“With continued momentum in music publishing, and a more robust schedule that includes the return of worldwide superstars and new artists breaking globally, we are optimistic about the second half of the year,” said Robert Kyncl, CEO, Warner Music Group. “As the music ecosystem continues to morph, and the use cases multiply, it only increases conviction in our tech-enabled strategy. In a highly proactive, fiscally responsible way, we’re investing in the artists, songwriters, team, and technology that will deliver continued growth and long-term success.”
“While macroeconomic, currency, and release slate headwinds continued to impact our revenue this quarter, our fiscal discipline enabled us to deliver solid Adjusted OIBDA growth and margin expansion,” said Eric Levin, CFO, Warner Music Group. “As we look to the future, we’ll combine A&R and marketing excellence with tech innovation to achieve greater efficiency, scale, and growth.”
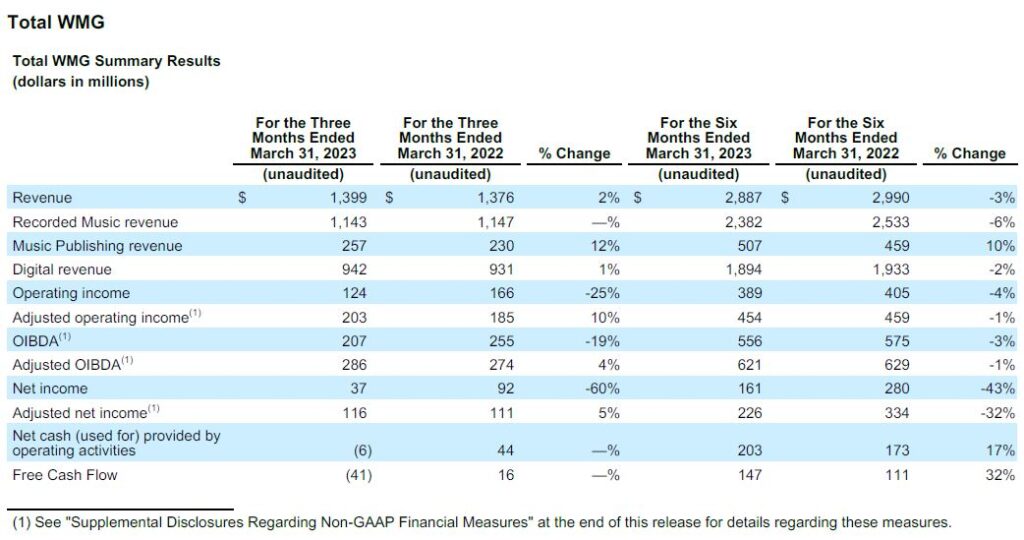
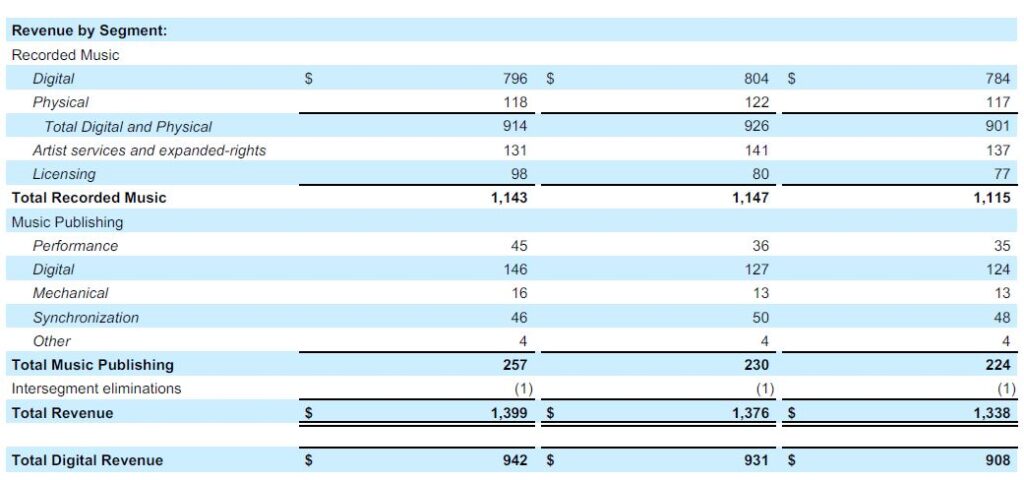
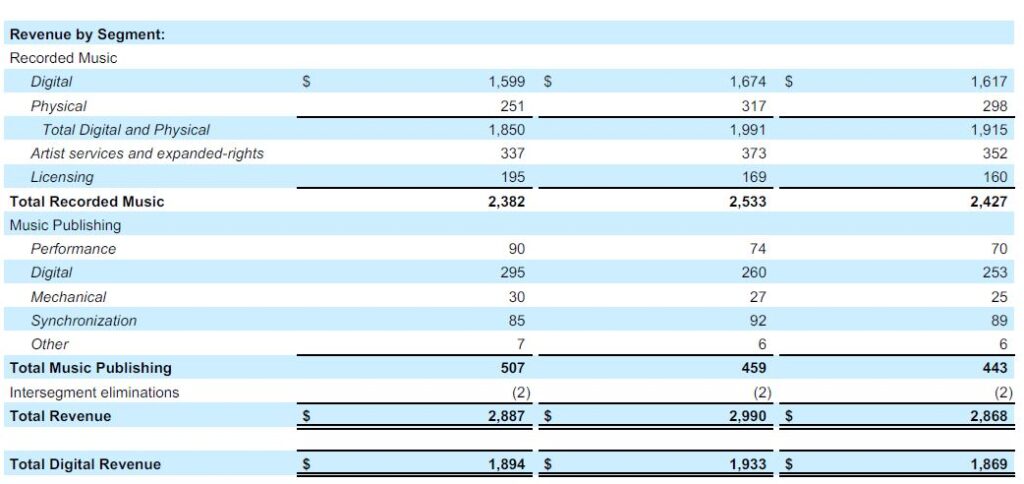
Revenue was up 1.7% (or 4.6% in constant currency). Consistent with the prior quarter, revenue growth was unfavorably impacted by foreign currency exchange rates. Digital revenue increased 1.2% (or 3.7% in constant currency) and streaming revenue increased 1.9% (or 4.5% in constant currency) primarily driven by growth in Music Publishing streaming revenue of 16.4% (or 18.3% in constant currency). Recorded Music streaming revenue decreased by 0.4% (or increased by 2.2% in constant currency) as a result of a lighter release schedule and the impact of exchange rates, as well as a market-related slowdown in ad-supported revenue. Recorded Music licensing revenue and Music Publishing performance and mechanical revenue all had double-digit growth. Recorded Music physical revenue decreased on an as-reported basis but increased in constant currency. Recorded Music artist services and expanded-rights revenue and Music Publishing synchronization revenue were lower on an as-reported basis and in constant currency.
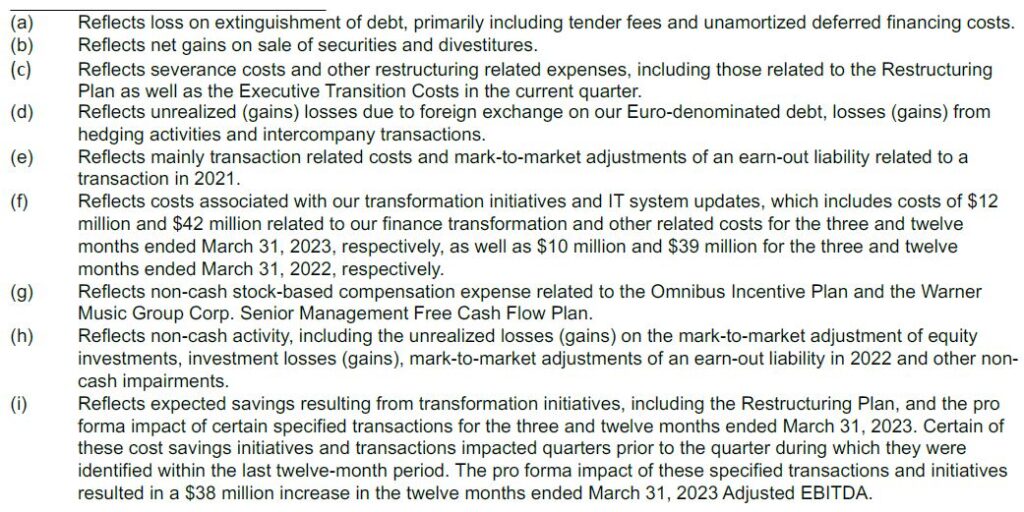
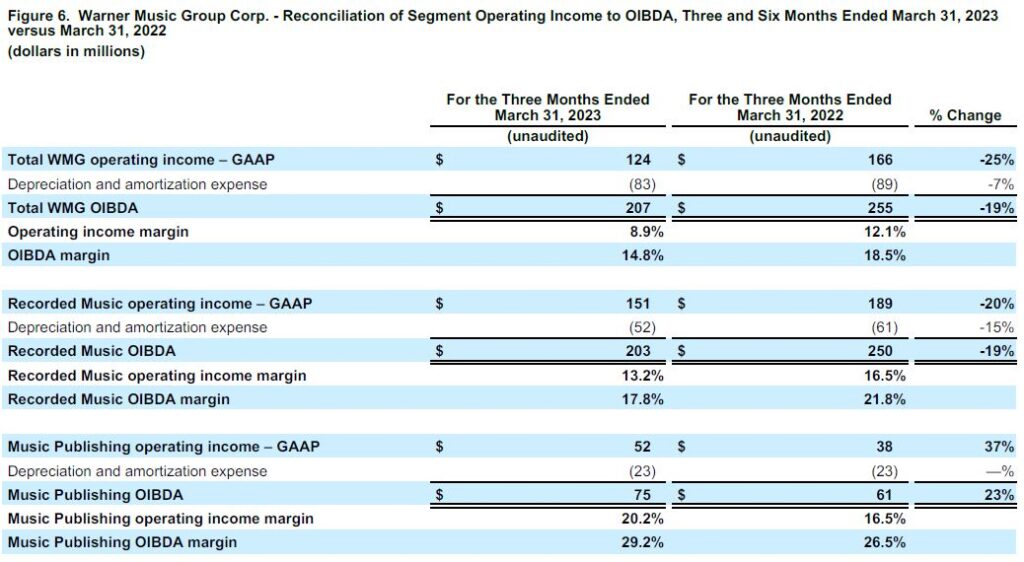
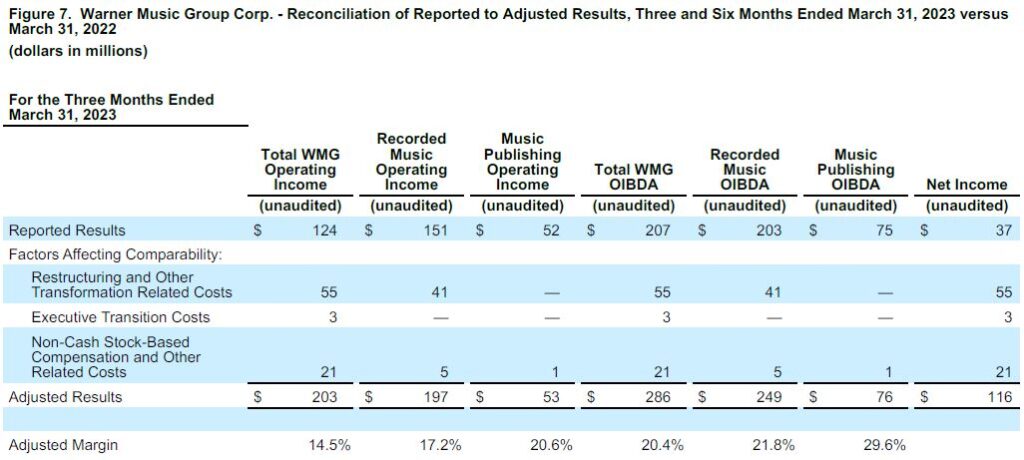
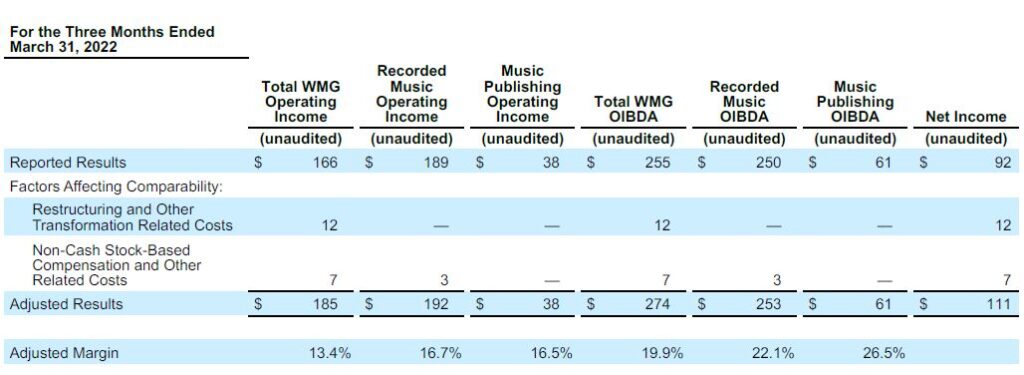
Operating income was $124 million compared to $166 million in the prior-year quarter. OIBDA was $207 million, compared to $255 million in the prior-year quarter, a decrease of 18.8% (or 15.9% in constant currency), and OIBDA margin decreased 3.7 percentage points to 14.8% from 18.5% in the prior-year quarter (or decreased 3.6 percentage points to 14.8% from 18.4% in constant currency). The decreases in operating income, OIBDA and OIBDA margin were primarily due to $41 million in severance costs related to the restructuring plan announced in the quarter (the “Restructuring Plan”), non-cash stock-based compensation and other related expenses primarily related to the departure of our previous CEO, and other costs associated with the departure of our previous CEO and planned departure of our CFO (the “Executive Transition Costs”).
Adjusted operating income, Adjusted OIBDA and Adjusted net income exclude expenses related to restructuring and other transformation initiatives and non-cash stock-based compensation and other related expenses in both the quarter and the prior-year quarter. In the quarter, the Executive Transition Costs are also excluded from these measures. Adjusted EBITDA excludes the aforementioned items and includes expected savings resulting from transformation initiatives and the pro forma impact of certain specified transactions. See below for calculations and reconciliations of Adjusted operating income, Adjusted OIBDA, Adjusted net income and Adjusted EBITDA.
Adjusted OIBDA increased 4.4% from $274 million to $286 million (or 7.9% in constant currency) and Adjusted OIBDA margin increased 0.5 percentage points to 20.4% from 19.9% in the prior-year quarter (or increased 0.6 percentage points to 20.4% from 19.8% in constant currency) primarily due to higher revenue and lower variable marketing spend, partially offset by revenue mix. Adjusted operating income increased 9.7% from $185 million to $203 million due to the same factors affecting Adjusted OIBDA, as well as lower amortization expenses due to certain intangible assets becoming fully amortized. Adjusted EBITDA increased, largely due to the same factors affecting Adjusted OIBDA and higher pro forma savings from certain cost-savings initiatives and the Restructuring Plan.
Net income was $37 million compared to $92 million in the prior-year quarter. Adjusted net income was $116 million compared to $111 million in the prior-year quarter. The decrease in net income and the increase in Adjusted net income were primarily due to the factors described above and the unfavorable impact of exchange rates on the Company’s Euro-denominated debt and intercompany loans, partially offset by a decrease in aggregate realized and unrealized losses related to certain investments and a decrease in income tax expense due to lower pre-tax income.
Basic and Diluted earnings per share was $0.06 for both the Class A and Class B shareholders due to the net income attributable to the Company in the quarter of $37 million.
As of March 31, 2023, the Company reported a cash balance of $601 million, total debt of $3.986 billion and net debt (defined as total debt, net of deferred financing costs, premiums and discounts, minus cash and equivalents) of $3.385 billion.
Cash from operating activities decreased 114% to a use of $6 million from a source of $44 million in the prior-year quarter. The decrease was largely a result of higher income and withholding tax payments primarily due to higher estimated U.S. taxable income, the utilization of certain remaining tax credits in the prior-year quarter, and other movements in working capital. Capital expenditures increased 25% to $35 million from $28 million in the prior-year quarter, mainly due to investments in IT capabilities. Free Cash Flow, as defined below, decreased to a use of $41 million from a source of $16 million in the prior-year quarter.
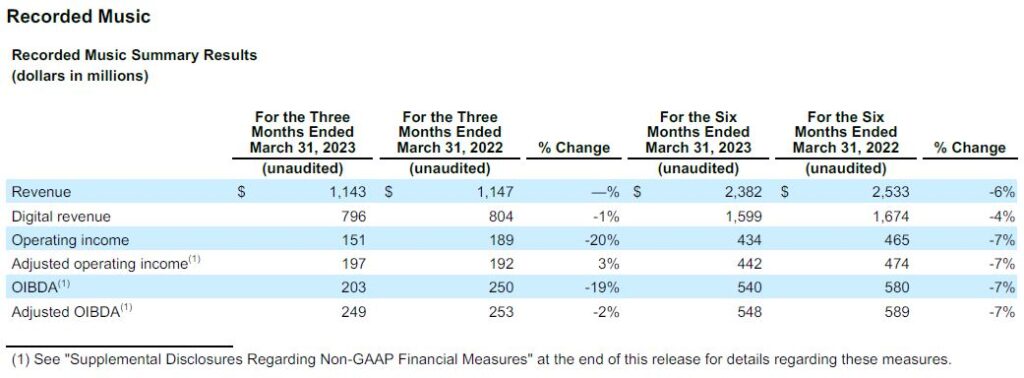
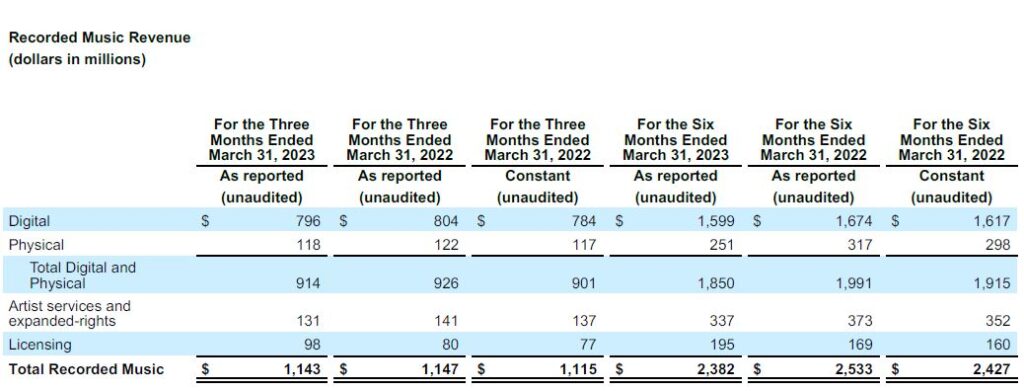
Recorded Music revenue was down 0.3% (or up 2.5% in constant currency). Digital revenue was down 1.0% (or up 1.5% in constant currency). Streaming revenue was down 0.4% (or up 2.2% in constant currency). Streaming revenue reflects a lighter release schedule and a market-related slowdown in ad-supported revenue. Licensing revenue increased 22.5% (or 27.3% in constant currency), including growth in brand income and a licensing settlement. Physical revenue was down 3.3% (or up 0.9% in constant currency) primarily due to the unfavorable impact of exchange rates, which offset strong performance in the United States. Artist services and expanded-rights revenue decreased 7.1% (or 4.4% in constant currency) primarily due to lower merchandising and advertising revenue, partially offset by an increase in concert promotion revenue. Major sellers included Michael Bublé, Ed Sheeran, Linkin Park, Zach Bryan and Dua Lipa.
Recorded Music operating income was $151 million, down from $189 million in the prior-year quarter and operating margin was down 3.3 percentage points to 13.2% versus 16.5% in the prior-year quarter. OIBDA decreased 18.8% to $203 million from $250 million in the prior-year quarter (or 15.8% in constant currency) and OIBDA margin decreased 4.0 percentage points to 17.8% from 21.8% in the prior-year quarter (or decreased 3.8 percentage points to 17.8% from 21.6% in constant currency). Adjusted OIBDA decreased 1.6% from $253 million to $249 million (or increased 2.0% in constant currency) with Adjusted OIBDA margin down 0.3 percentage points to 21.8% from 22.1% in the prior-year quarter (or down 0.1 percentage point to 21.8% from 21.9% in constant currency). The decreases in operating income, OIBDA, operating margin and OIBDA margin were primarily due to the Restructuring Plan. The decreases in Adjusted OIBDA and Adjusted OIBDA margin were primarily driven by revenue mix, partially offset by lower variable marketing spend.
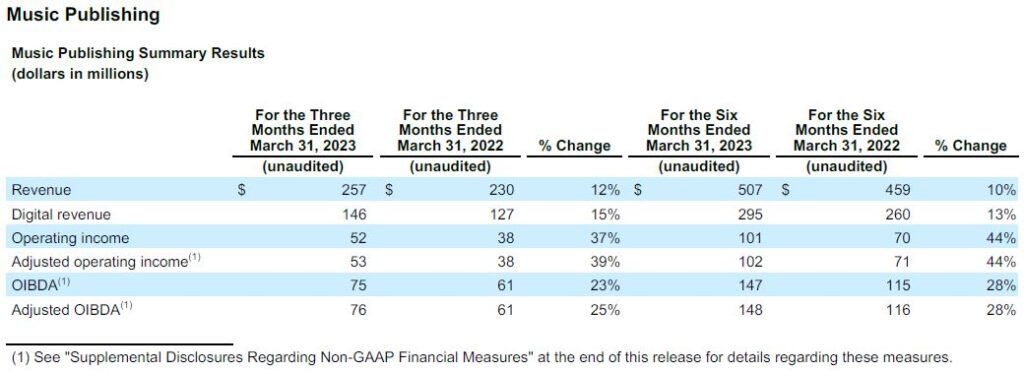
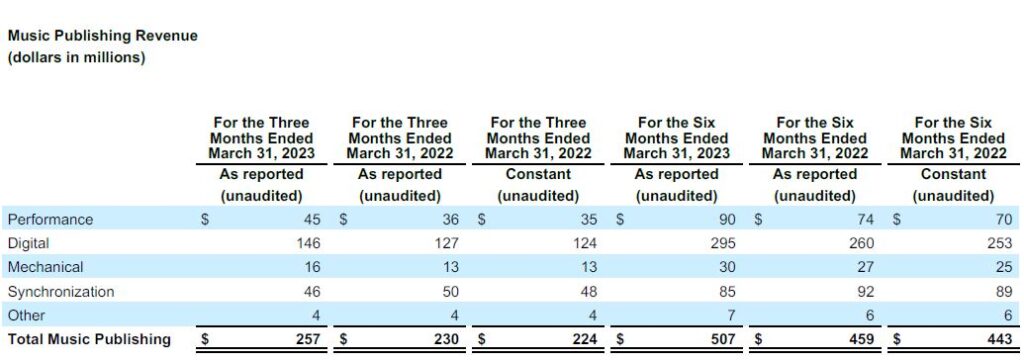
Music Publishing revenue increased 11.7% (or 14.7% in constant currency). The increase was driven by growth in digital, performance and mechanical revenue. Digital revenue increased 15.0% (or 17.7% in constant currency) and streaming revenue increased 16.4% (or 18.3% in constant currency), reflecting the continued growth in streaming and the impact of digital deal renewals. Performance revenue increased due to the timing of payments from collection societies and continued recovery from COVID disruption. Mechanical revenue increased driven by strong share of physical sales. Synchronization revenue was lower on an as-reported basis and in constant currency, primarily due to lower commercial licensing activity in the United States, partially offset by copyright infringement settlements.
Music Publishing operating income was $52 million compared to $38 million in the prior-year quarter and operating margin increased 3.7 percentage points to 20.2%. Music Publishing OIBDA increased 23.0% to $75 million (the same in constant currency) and OIBDA margin increased 2.7 percentage points to 29.2% from 26.5% in the prior-year quarter (or increased 2.0 percentage points to 29.2% from 27.2% in constant currency). Adjusted OIBDA increased 24.6% to $76 million (the same in constant currency) and Adjusted OIBDA margin increased 3.1 percentage points to 29.6% from 26.5% in the prior-year quarter (or increased 2.4 percentage points to 29.6% from 27.2% in constant currency). The increases in operating income, OIBDA and Adjusted OIBDA were primarily due to strong operating performance.
Financial details for the quarter can be found in the Company’s current Quarterly Report on Form 10-Q for the period ended March 31, 2023, filed today with the Securities and Exchange Commission.
This morning, management will be hosting a conference call to discuss the results at 8:30 A.M. EST. The call will be webcast on www.wmg.com.
With a legacy extending back over 200 years, Warner Music Group today is home to an unparalleled family of creative artists, songwriters, and companies that are moving culture across the globe. At the core of WMG’s Recorded Music division are four of the most iconic companies in history: Atlantic, Elektra, Parlophone and Warner Records. They are joined by renowned labels such as 300 Entertainment, Asylum, Big Beat, Canvasback, East West, Erato, FFRR, Fueled by Ramen, Nonesuch, Reprise, Rhino, Roadrunner, Sire, Spinnin’ Records, Warner Classics and Warner Music Nashville. Warner Chappell Music – which traces its origins back to the founding of Chappell & Company in 1811 – is one of the world’s leading music publishers, with a catalog of more than one million copyrights spanning every musical genre from the standards of the Great American Songbook to the biggest hits of the 21st century.
“Safe Harbor” Statement under Private Securities Litigation Reform Act of 1995
This communication includes forward-looking statements that reflect the current views of Warner Music Group about future events and financial performance. Words such as “estimates,” “expects,” “anticipates,” “projects,” “plans,” “intends,” “believes,” “forecasts” and variations of such words or similar expressions that predict or indicate future events or trends, or that do not relate to historical matters, identify forward-looking statements. All forward-looking statements are made as of today, and we disclaim any duty to update such statements. Our expectations, beliefs and projections are expressed in good faith, and we believe there is a reasonable basis for them. However, we cannot assure you that management’s expectations, beliefs and projections will result or be achieved. Investors should not rely on forward-looking statements because they are subject to a variety of risks, uncertainties, and other factors that could cause actual results to differ materially from our expectations. Please refer to our Form 10-K, Form 10-Qs and our other filings with the U.S. Securities and Exchange Commission concerning factors that could cause actual results to differ materially from those described in our forward-looking statements.
We maintain an Internet site at www.wmg.com. We use our website as a channel of distribution for material company information. Financial and other material information regarding Warner Music Group is routinely posted on and accessible at http://investors.wmg.com. In addition, you may automatically receive email alerts and other information about Warner Music Group by enrolling your email address through the “email alerts” section at http://investors.wmg.com. Our website and the information posted on it or connected to it shall not be deemed to be incorporated by reference into this communication.
Basis of Presentation
Effective for the 2023 fiscal year, the Company’s fiscal year was modified from a 52-53-week calendar, in which reporting periods ended on the last Friday of the calendar quarter, to a reporting calendar in which the reporting periods end on the last day of the calendar quarter. The Company’s fiscal year will begin on October 1 and end on September 30 of each year. Prior to the start of the 2023 fiscal year, the Company maintained a 52-53 week fiscal year ending on the last Friday in each reporting period. The fiscal year ended September 30, 2022 included 53 weeks, with the additional week falling in the fiscal quarter ended December 31, 2021. Accordingly, the results of operations for the three months ended December 31, 2021 reflect 14 weeks, or 98 days, compared to 92 days for the three months ended December 31, 2022.
Supplemental Disclosures Regarding Non-GAAP Financial Measures
We evaluate our operating performance based on several factors, including the following non-GAAP financial measures:
OIBDA
OIBDA reflects our operating income before non-cash depreciation of tangible assets and non-cash amortization of intangible assets. We consider OIBDA to be an important indicator of the operational strengths and performance of our businesses and believe the presentation of OIBDA helps improve the ability to understand our operating performance and evaluate our performance in comparison to comparable periods. However, a limitation of the use of OIBDA as a performance measure is that it does not reflect the periodic costs of certain capitalized tangible and intangible assets used in generating revenue in our businesses. Accordingly, OIBDA should be considered in addition to, not as a substitute for, operating income (loss), net income (loss) and other measures of financial performance reported in accordance with U.S. GAAP. In addition, OIBDA, as we calculate it, may not be comparable to similarly titled measures employed by other companies.
Adjusted Operating Income (Loss), Adjusted OIBDA and Adjusted Net Income (Loss)
Adjusted operating income (loss), Adjusted OIBDA and Adjusted net income (loss) is operating income (loss), OIBDA and net income (loss), respectively, adjusted to exclude the impact of certain items that affect comparability. Factors affecting period-to-period comparability of the unadjusted measures in the quarter included the items listed in Figure 7 below. We use Adjusted operating income (loss), Adjusted OIBDA and Adjusted net income (loss) to evaluate our actual operating performance. We believe that the adjusted results provide relevant and useful information for investors because they clarify our actual operating performance, make it easier to compare our results with those of other companies in our industry and allow investors to review performance in the same way as our management. Since these are not measures of performance calculated in accordance with U.S. GAAP, they should not be considered in isolation of, or as a substitute for, operating income (loss), OIBDA and net income (loss) as indicators of operating performance, and they may not be comparable to similarly titled measures employed by other companies.

Constant Currency
Because exchange rates are an important factor in understanding period-to-period comparisons, we believe the presentation of revenue on a constant-currency basis in addition to reported revenue helps improve the ability to understand our operating results and evaluate our performance in comparison to prior periods. Constant-currency information compares results between periods as if exchange rates had remained constant period over period. We use results on a constant-currency basis as one measure to evaluate our performance. We calculate constant-currency results by applying current-year foreign currency exchange rates to prior-year results. However, a limitation of the use of the constant-currency results as a performance measure is that it does not reflect the impact of exchange rates on our revenue. These results should be considered in addition to, not as a substitute for, results reported in accordance with U.S. GAAP. Results on a constant-currency basis, as we present them, may not be comparable to similarly titled measures used by other companies and are not a measure of performance presented in accordance with U.S. GAAP.
Free Cash Flow
Our definition of Free Cash Flow is defined as cash flow provided by operating activities less capital expenditures. We use Free Cash Flow, among other measures, to evaluate our operating performance. Management believes Free Cash Flow provides investors with an important perspective on the cash available to fund our debt service requirements, ongoing working capital requirements, capital expenditure requirements, strategic acquisitions and investments, and any dividends, prepayments of debt or repurchases or retirement of our outstanding debt or notes in open market purchases, privately negotiated purchases, any repurchases of our common stock or otherwise. As a result, Free Cash Flow is a significant measure of our ability to generate long-term value. It is useful for investors to know whether this ability is being enhanced or degraded as a result of our operating performance. We believe the presentation of Free Cash Flow is relevant and useful for investors because it allows investors to view performance in a manner similar to the method management uses.
Free Cash Flow is not a measure of performance calculated in accordance with U.S. GAAP and therefore it should not be considered in isolation of, or as a substitute for, net income (loss) as an indicator of operating performance or cash flow provided by operating activities as a measure of liquidity. Free Cash Flow, as we calculate it, may not be comparable to similarly titled measures employed by other companies. In addition, Free Cash Flow does not necessarily represent funds available for discretionary use and is not necessarily a measure of our ability to fund our cash needs. Because Free Cash Flow deducts capital expenditures from “net cash provided by operating activities” (the most directly comparable U.S. GAAP financial measure), users of this information should consider the types of events and transactions that are not reflected. We provide below a reconciliation of Free Cash Flow to the most directly comparable amount reported under U.S. GAAP, which is “net cash provided by operating activities.”
Adjusted EBITDA
Adjusted EBITDA is equivalent to “EBITDA” as defined in our Revolving Credit Facility and our 2020 indenture and substantially similar to “EBITDA” as defined under our Senior Term Loan Facility, respectively. Adjusted EBITDA differs from the term “EBITDA” as it is commonly used. The definition of Adjusted EBITDA, in addition to adjusting net income to exclude interest expense, income taxes, and depreciation and amortization, also adjusts net income by excluding items or expenses such as, among other items, (1) the amount of any restructuring charges or reserves; (2) any non-cash charges (including any impairment charges); (3) any net loss resulting from hedging currency exchange risks; (4) the amount of management, monitoring, consulting and advisory fees paid to Access under the Management Agreement or otherwise; (5) business optimization expenses (including consolidation initiatives, severance costs and other costs relating to initiatives aimed at profitability improvement); (6) transaction expenses; (7) equity-based compensation expense; and (8) certain extraordinary, unusual or non-recurring items. The definition of EBITDA under the Revolving Credit Facility also includes adjustments for the pro forma impact of certain projected cost savings, operating expense reductions and synergies and any quality of earnings analysis prepared by independent certified public accountants in connection with an acquisition, merger, consolidation or other investment.
Adjusted EBITDA is a key measure used by our management to understand and evaluate our operating performance, generate future operating plans and make strategic decisions regarding the allocation of capital. Adjusted EBITDA has limitations as an analytical tool, and you should not consider it in isolation or as a substitute for analysis of our results as reported under U.S. GAAP. Some of those limitations include: (1) it does not reflect the periodic costs of certain capitalized tangible and intangible assets used in generating revenue for our business; (2) it does not reflect the significant interest expense or cash requirements necessary to service interest or principal payments on our indebtedness; and (3) it does not reflect every cash expenditure, future requirements for capital expenditures or contractual commitments. In particular, this measure adds back certain non-cash, extraordinary, unusual or non-recurring charges that are deducted in calculating net income; however, these are expenses that may recur, vary greatly and are difficult to predict. In addition, Adjusted EBITDA is not the same as net income or cash flow provided by operating activities as those terms are defined by U.S. GAAP and does not necessarily indicate whether cash flows will be sufficient to fund cash needs. Accordingly, Adjusted EBITDA should be considered in addition to, not as a substitute for, net income (loss) and other measures of financial performance reported in accordance with U.S. GAAP.